
Observability
Install Telemetry Add-ons
Using Meshery, install Istio telemetry add-ons. In the Istio management page:
- Click the (+) icon on the
Apply Service Mesh Configurationcard. - Select each of the following add-ons:
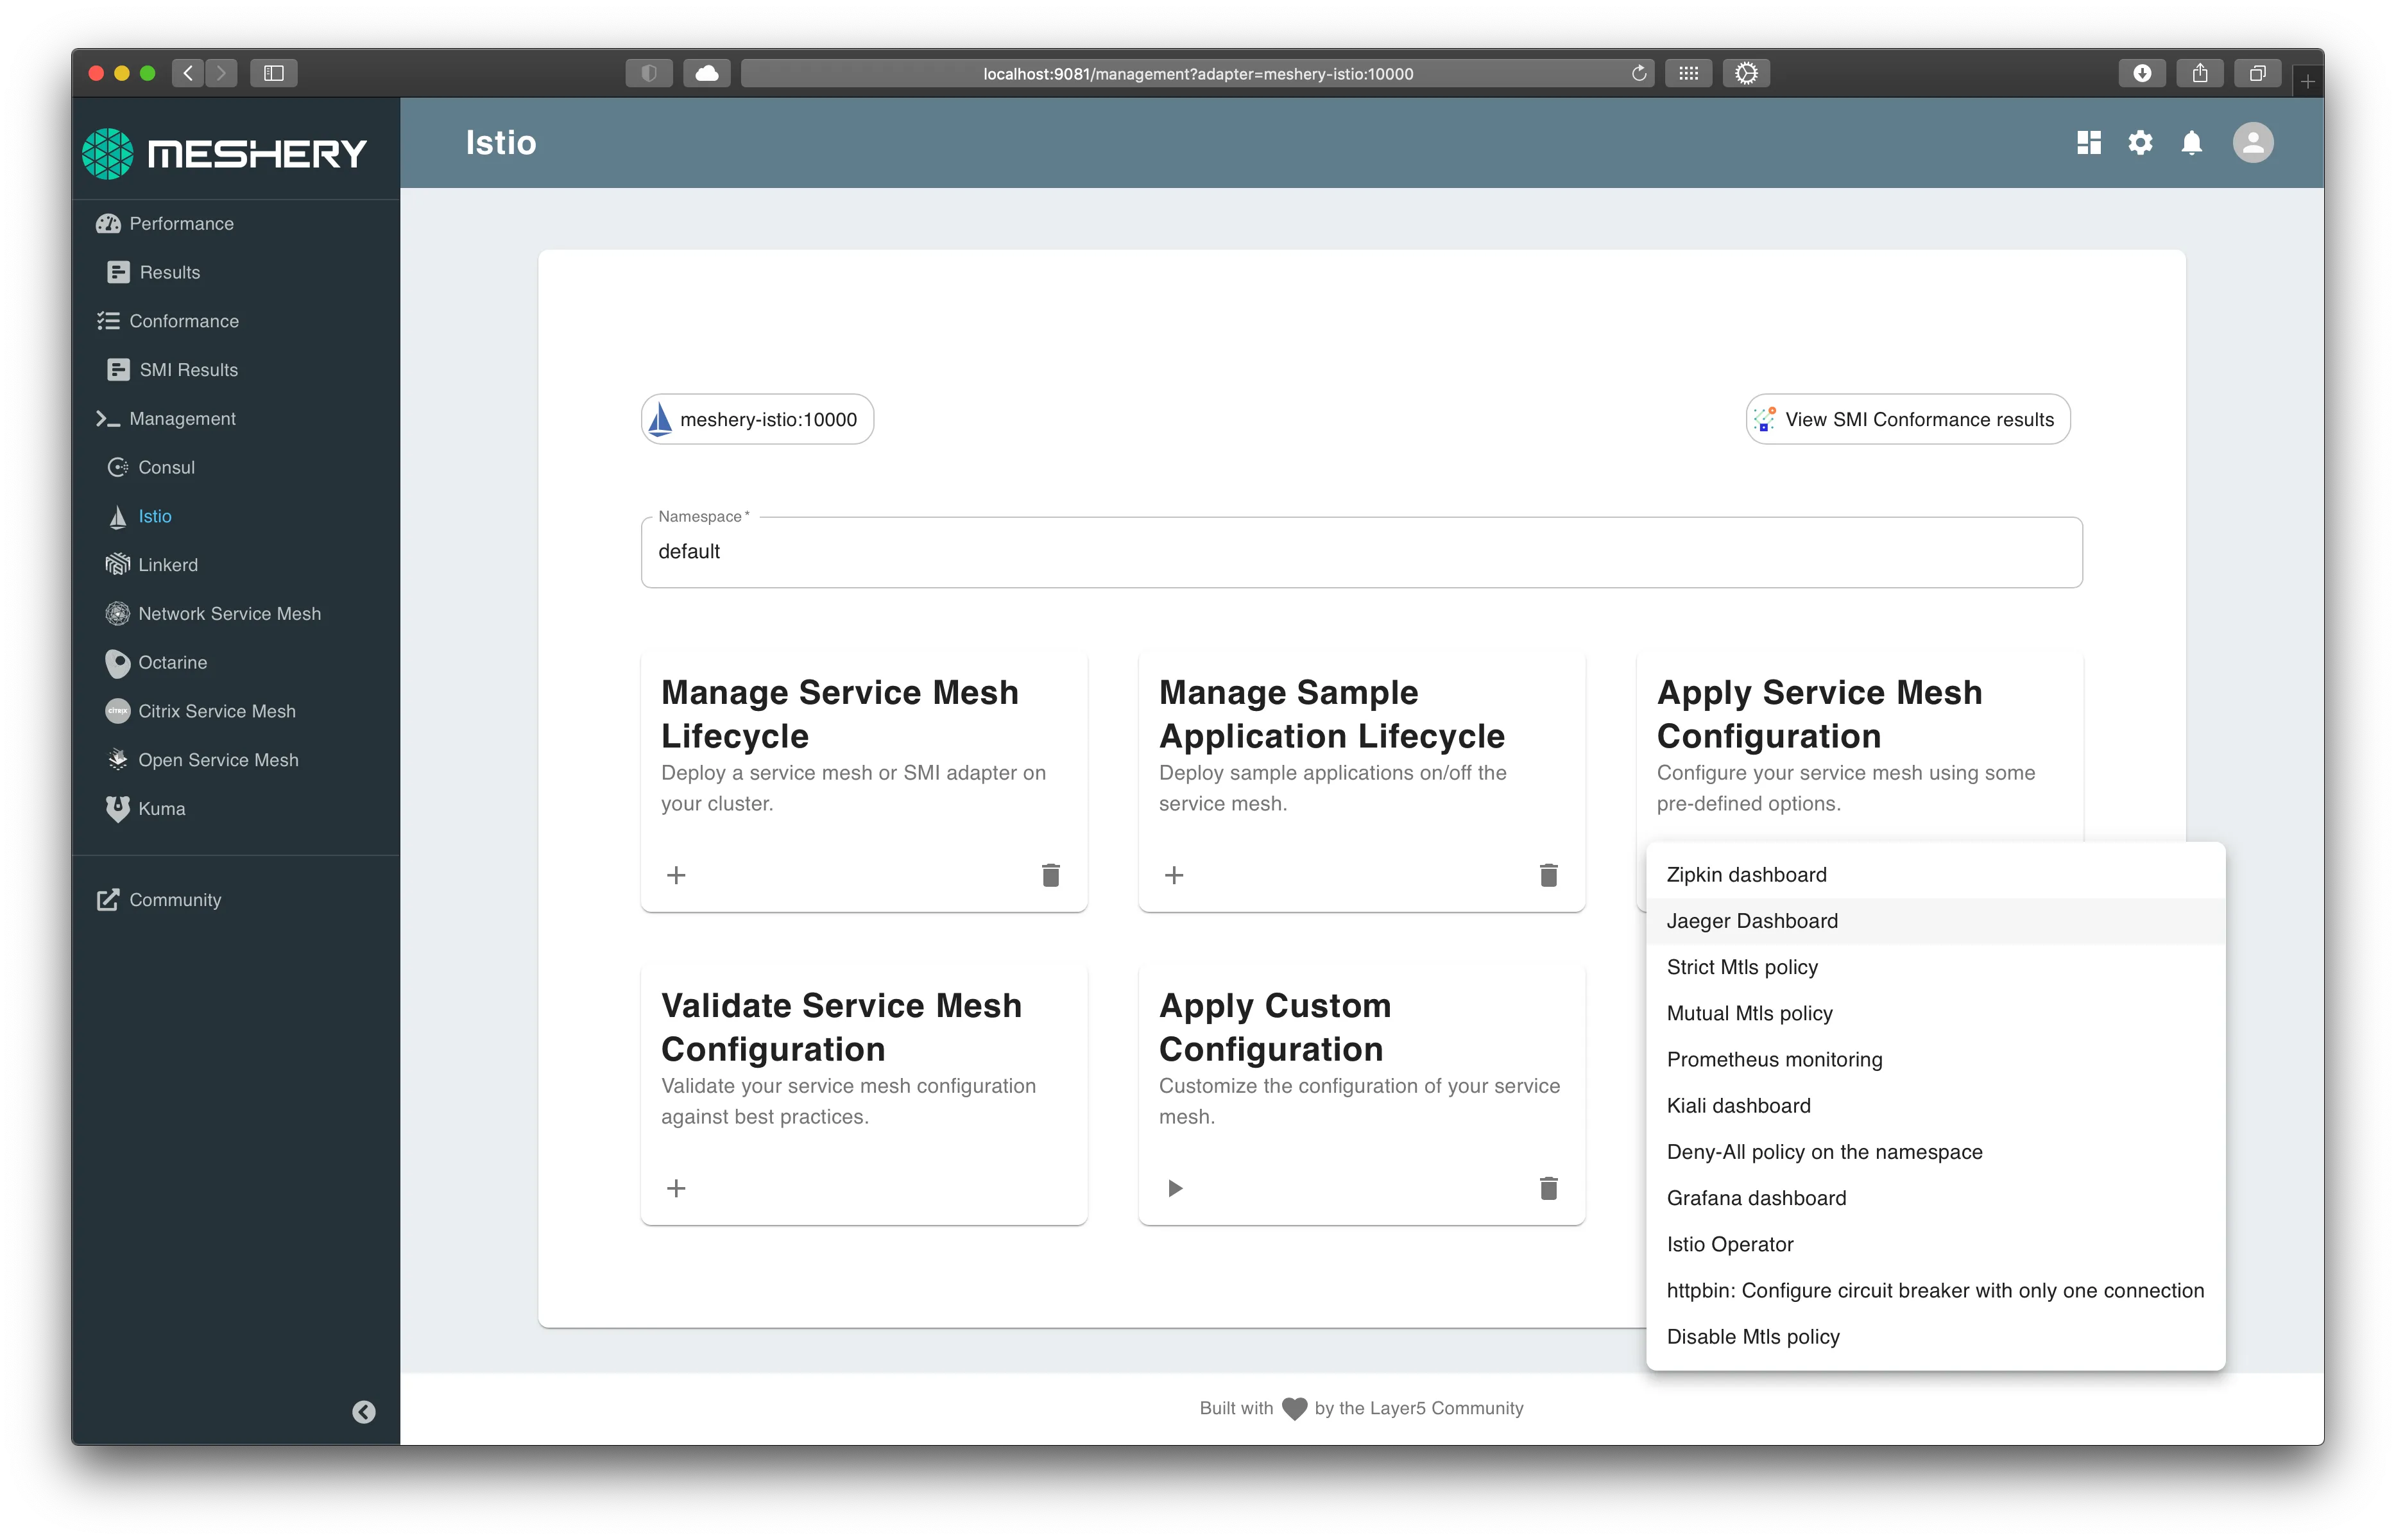
You will use Prometheus and Grafana for collecting and viewing metrics and Jaeger collecting and viewing distributed traces. Expose each add-on external to the cluster. Each the service network typs are set to "LoadBalancer".
Service Mesh Performance and Telemetry
Many of the labs require load to be placed on the sample apps. Let's generate HTTP traffic against the BookInfo application, so we can see interesting telemetry.
Verify access through the Ingress Gateway:
1kubectl get service istio-ingressgateway -n istio-system
Once we have the port, we can append the IP of one of the nodes to get the host.
The URL to run a load test against will be http://<IP/hostname of any of the nodes in the cluster>:<ingress port>/productpage
Please note: If you are using Docker Desktop, please use the IP address of your host. You can leave the port blank. For example: http://1.2.3.4/productpage
Use the computed URL above in Meshery, in the browser, to run a load test and see the results.
Connect Grafana (optionally, Prometheus) to Meshery.
On the Settings page:
- Navigate to the
Metricstab. - Enter Grafana's URL:port number and submit.
Use Meshery to generate load and analyze performance.
On the Performance page:
- give this load test a memorable name
- enter the URL to the BookInfo productpage
- select
Istioin theService Meshdropdown - enter a valid number for
Concurrent requests - enter a valid number for
Queries per second - enter a valid
Duration(a number followed bysfor seconds (OR)mfor minutes (OR)hfor hour) - use the host IP address in the request Tab and in the advanced options, type in the header as
Host:<app-name>
Click on Run Test. A performance test will run and statistical analysis performed. Examine the results of the test and behavior of the service mesh.
Next, you will begin controlling requests to BookInfo using traffic management features.
Alternative: Manual installation
Follow these steps if the above steps did not workInstall Add-ons:
Prometheus
1kubectl apply -f https://raw.githubusercontent.com/istio/istio/release-1.7/samples/addons/prometheus.yaml
Grafana
1kubectl apply -f https://raw.githubusercontent.com/istio/istio/release-1.7/samples/addons/grafana.yaml
Jaeger
1kubectl apply -f https://raw.githubusercontent.com/istio/istio/release-1.7/samples/addons/jaeger.yaml
Exposing services
Istio add-on services are deployed by default as ClusterIP type services. We can expose the services outside the cluster by either changing the Kubernetes service type to NodePort or LoadBalancer or by port-forwarding or by configuring Kubernetes Ingress.
Option 1: Expose services with NodePort
To expose them using NodePort service type, we can edit the services and change the service type from ClusterIP to NodePort
Option 2: Expose services with port-forwarding
Port-forwarding runs in the foreground. We have appended & to the end of the above 2 commands to run them in the background. If you donot want this behavior, please remove the & from the end.
Prometheus
You will need to expose the Prometheus service on a port either of the two following methods:
Option 1: Expose services with NodePort
1kubectl -n istio-system edit svc prometheus
To find the assigned ports for Prometheus:
1kubectl -n istio-system get svc prometheus
Option 2: Expose Prometheus service with port-forwarding: ** Expose Prometheus service with port-forwarding:
1kubectl -n istio-system port-forward \2 $(kubectl -n istio-system get pod -l app=prometheus -o jsonpath='{.items[0].metadata.name}') \3 9090:9090 &
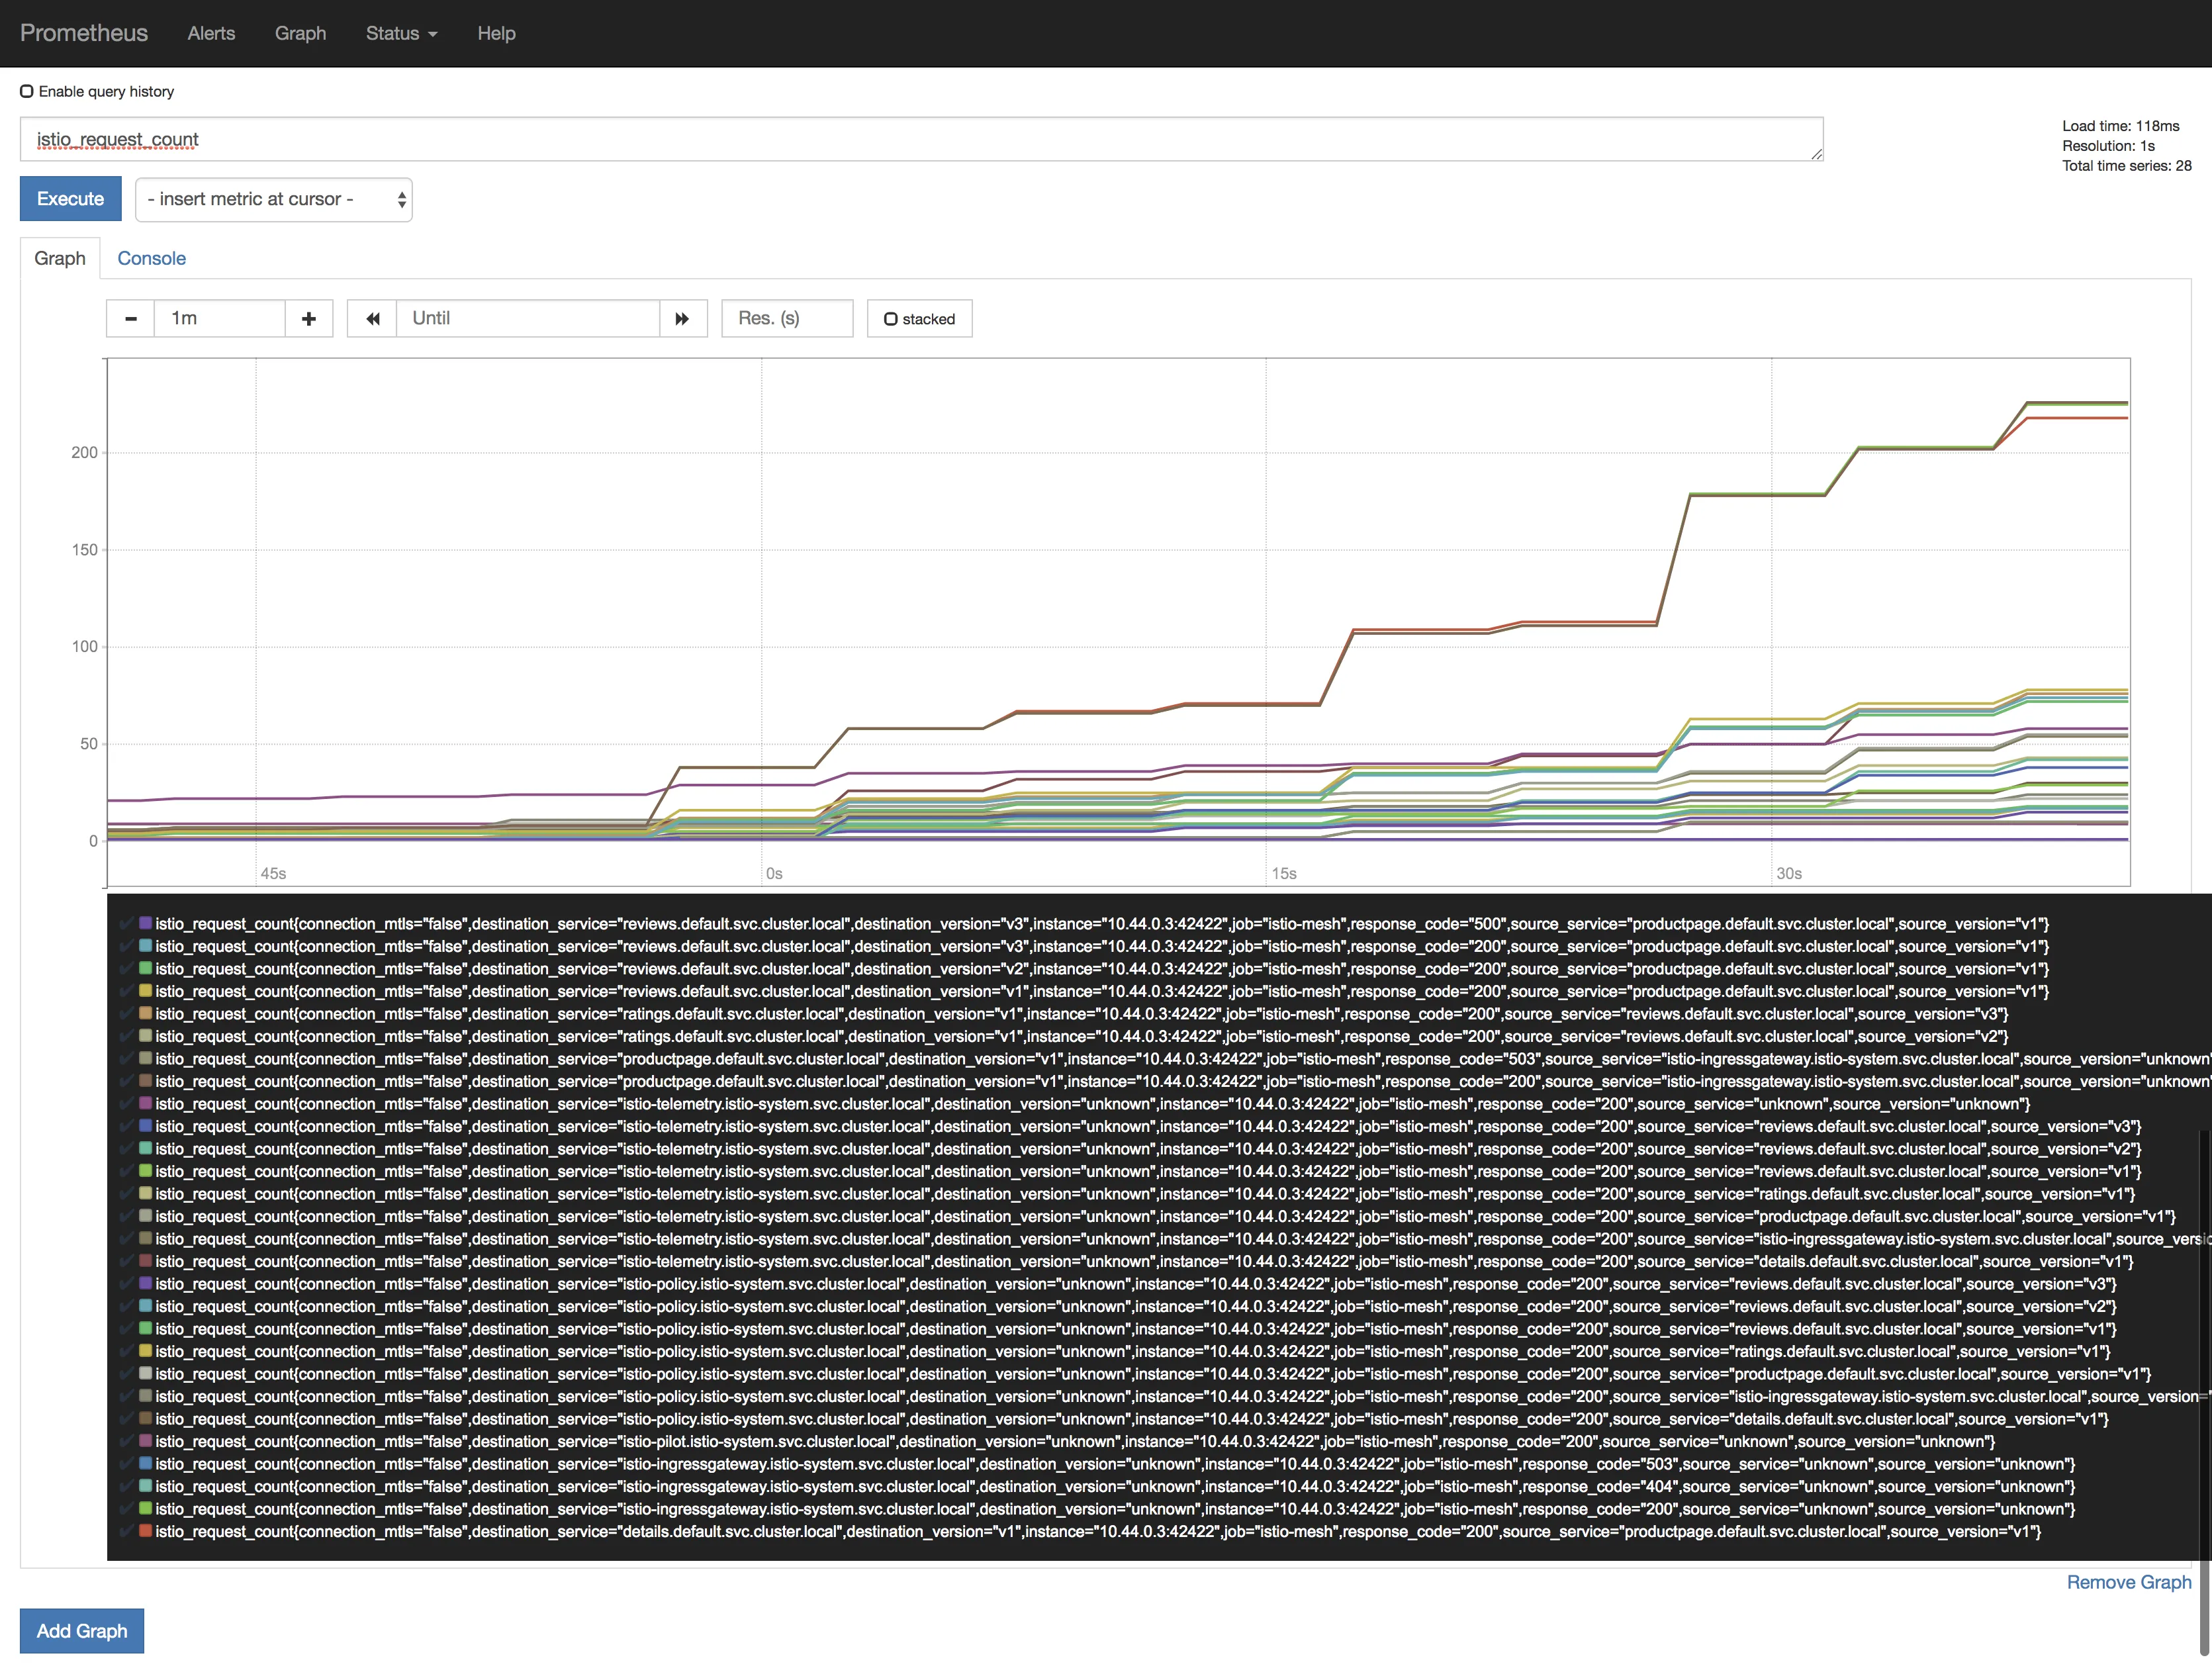
Browse to http://<ip>:<port> and in the Expression input box enter: istio_request_bytes_count. Click the Execute button.
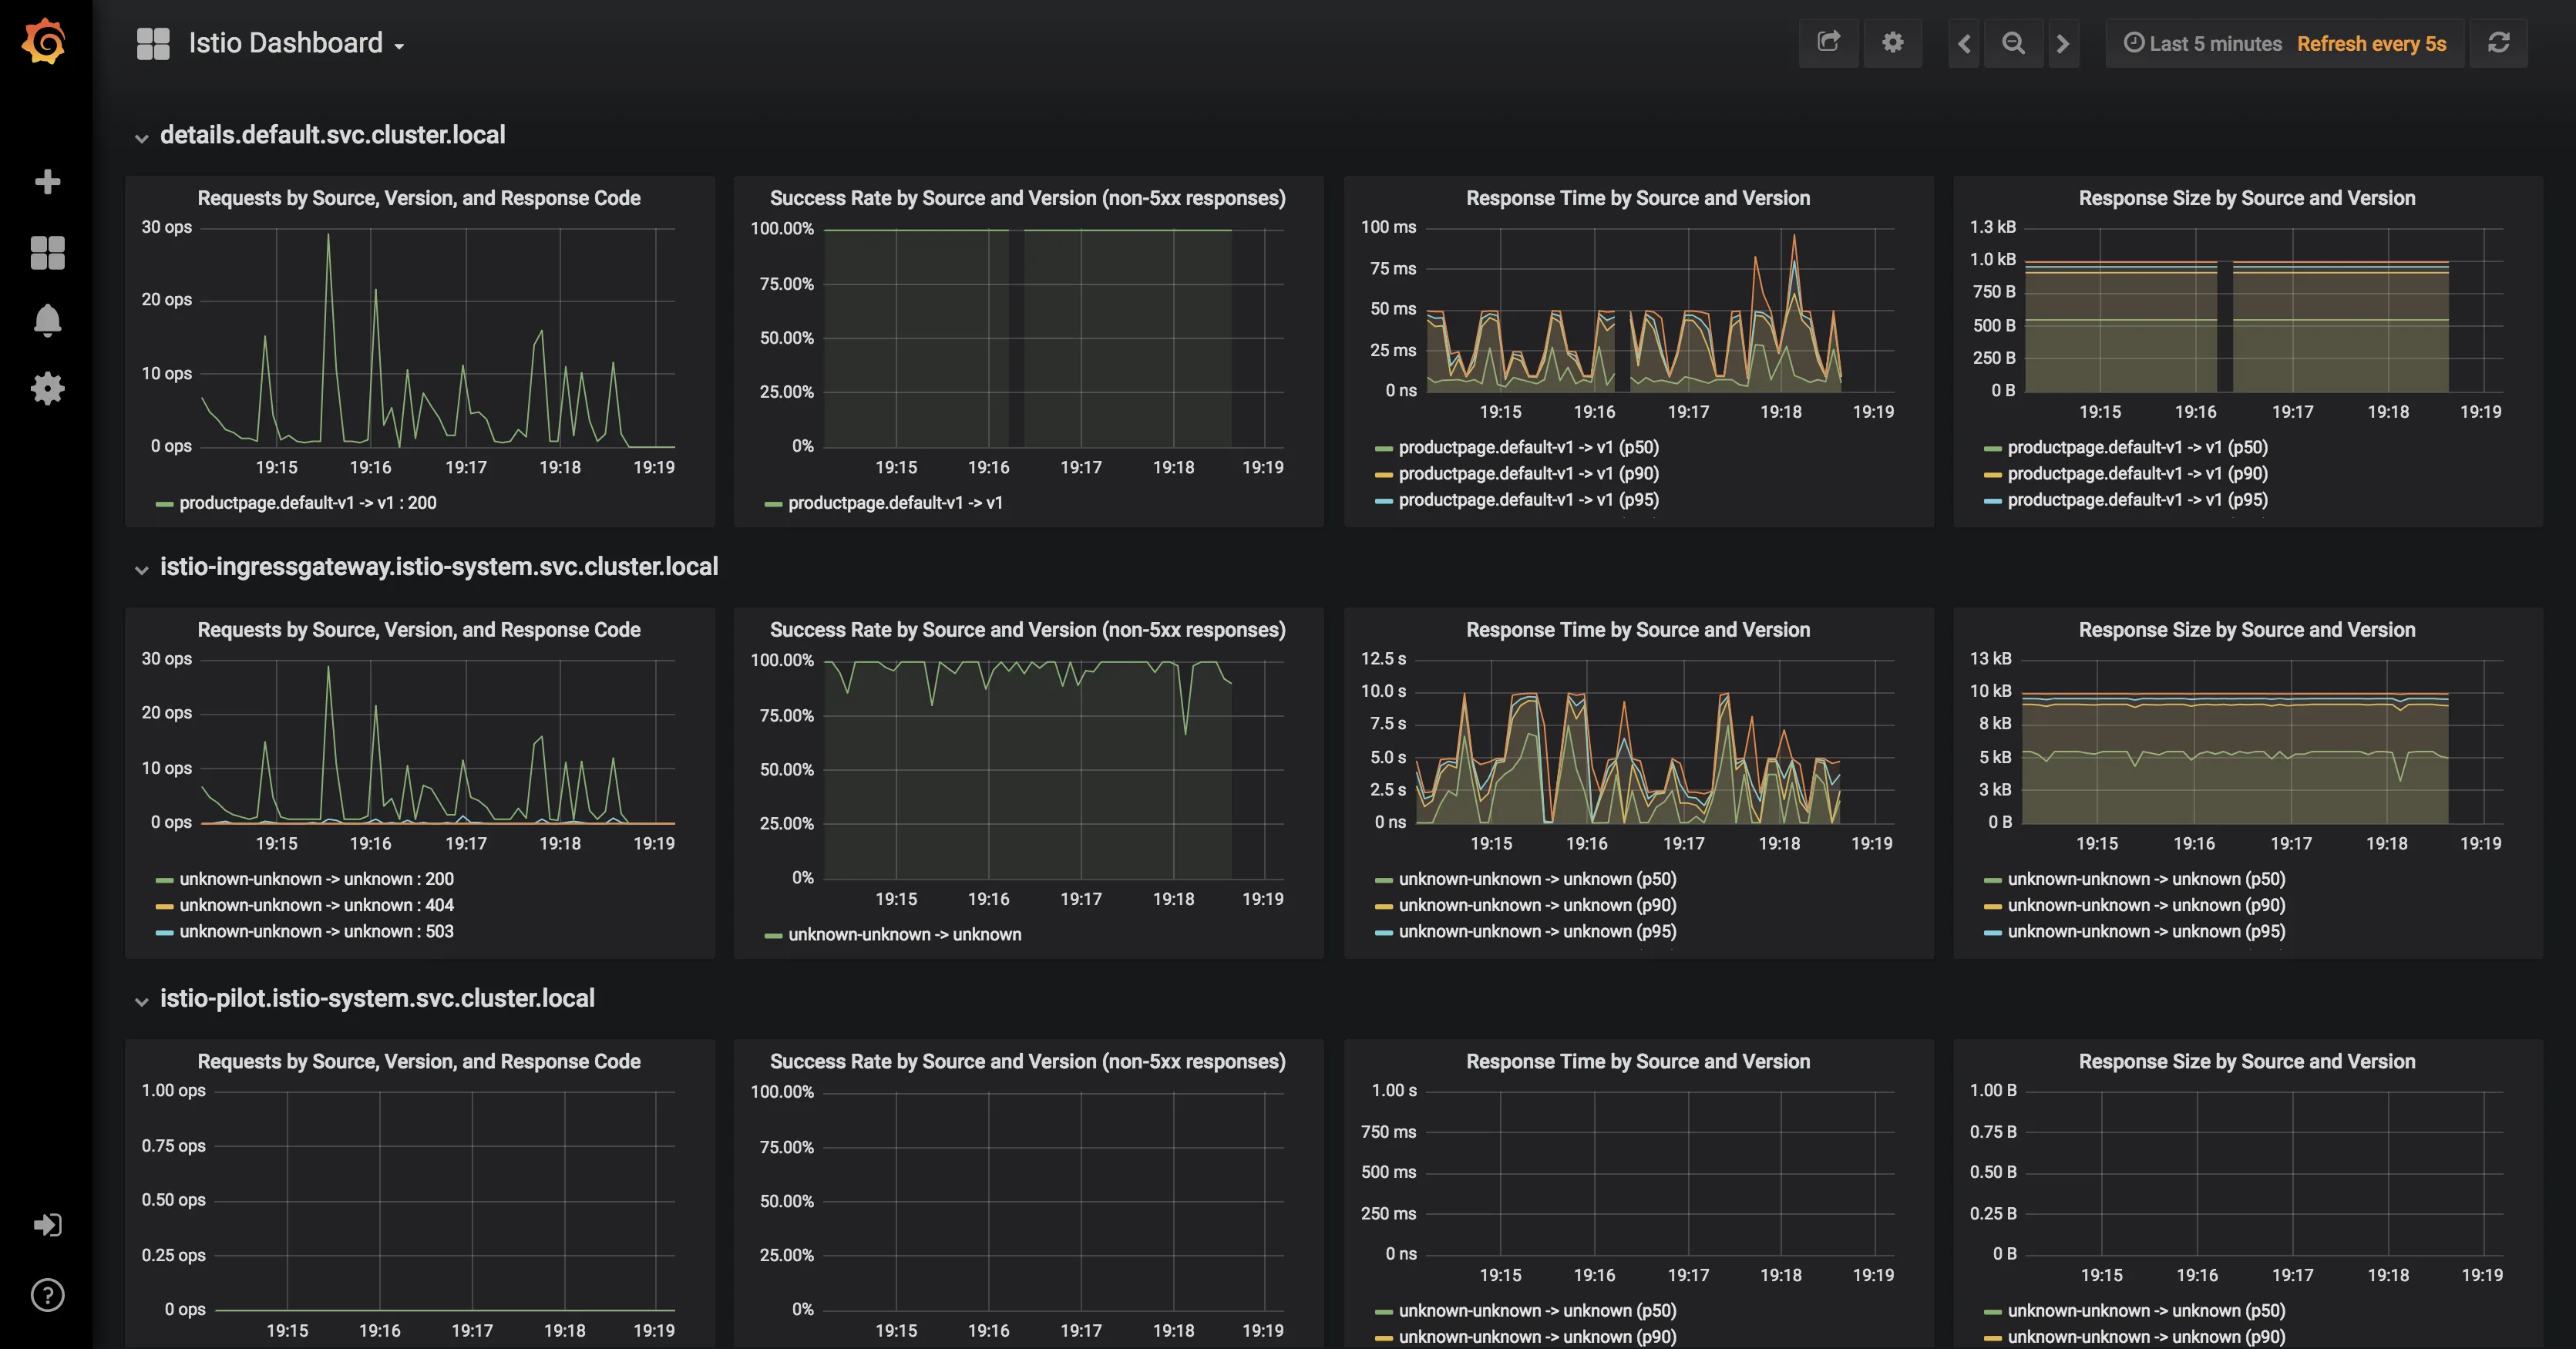
Grafana
You will need to expose the Grafana service on a port either of the two following methods:
1kubectl -n istio-system edit svc grafana
Once this is done the services will be assigned dedicated ports on the hosts.
To find the assigned ports for Grafana:
1kubectl -n istio-system get svc grafana
Expose Grafana service with port-forwarding:
1kubectl -n istio-system port-forward $(kubectl -n istio-system get pod -l app=grafana \2 -o jsonpath='{.items[0].metadata.name}') 3000:3000 &
Distributed Tracing
The sample Bookinfo application is configured to collect trace spans using Zipkin or Jaeger. Although Istio proxies are able to automatically send spans, it needs help from the application to tie together the entire trace. To do this applications need to propagate the appropriate HTTP headers so that when the proxies send span information to Zipkin or Jaeger, the spans can be correlated correctly into a single trace.
To do this the application collects and propagates the following headers from the incoming request to any outgoing requests:
x-request-idx-b3-traceidx-b3-spanidx-b3-parentspanidx-b3-sampledx-b3-flagsx-ot-span-context
Exposing services
Istio add-on services are deployed by default as ClusterIP type services. We can expose the services outside the cluster by either changing the Kubernetes service type to NodePort or LoadBalancer or by port-forwarding or by configuring Kubernetes Ingress. In this lab, we will briefly demonstrate the NodePort and port-forwarding ways of exposing services.
Option 1: Expose services with NodePort
To expose them using NodePort service type, we can edit the services and change the service type from ClusterIP to NodePort
For Jaeger, either of tracing or jaeger-query can be exposed.
1kubectl -n istio-system edit svc tracing
Once this is done the services will be assigned dedicated ports on the hosts.
To find the assigned ports for Jaeger:
1kubectl -n istio-system get svc tracing
Option 2: Expose services with port-forwarding
To port-forward Jaeger:
1kubectl -n istio-system port-forward \2 $(kubectl -n istio-system get pod -l app=jaeger -o jsonpath='{.items[0].metadata.name}') \3 16686:16686 &
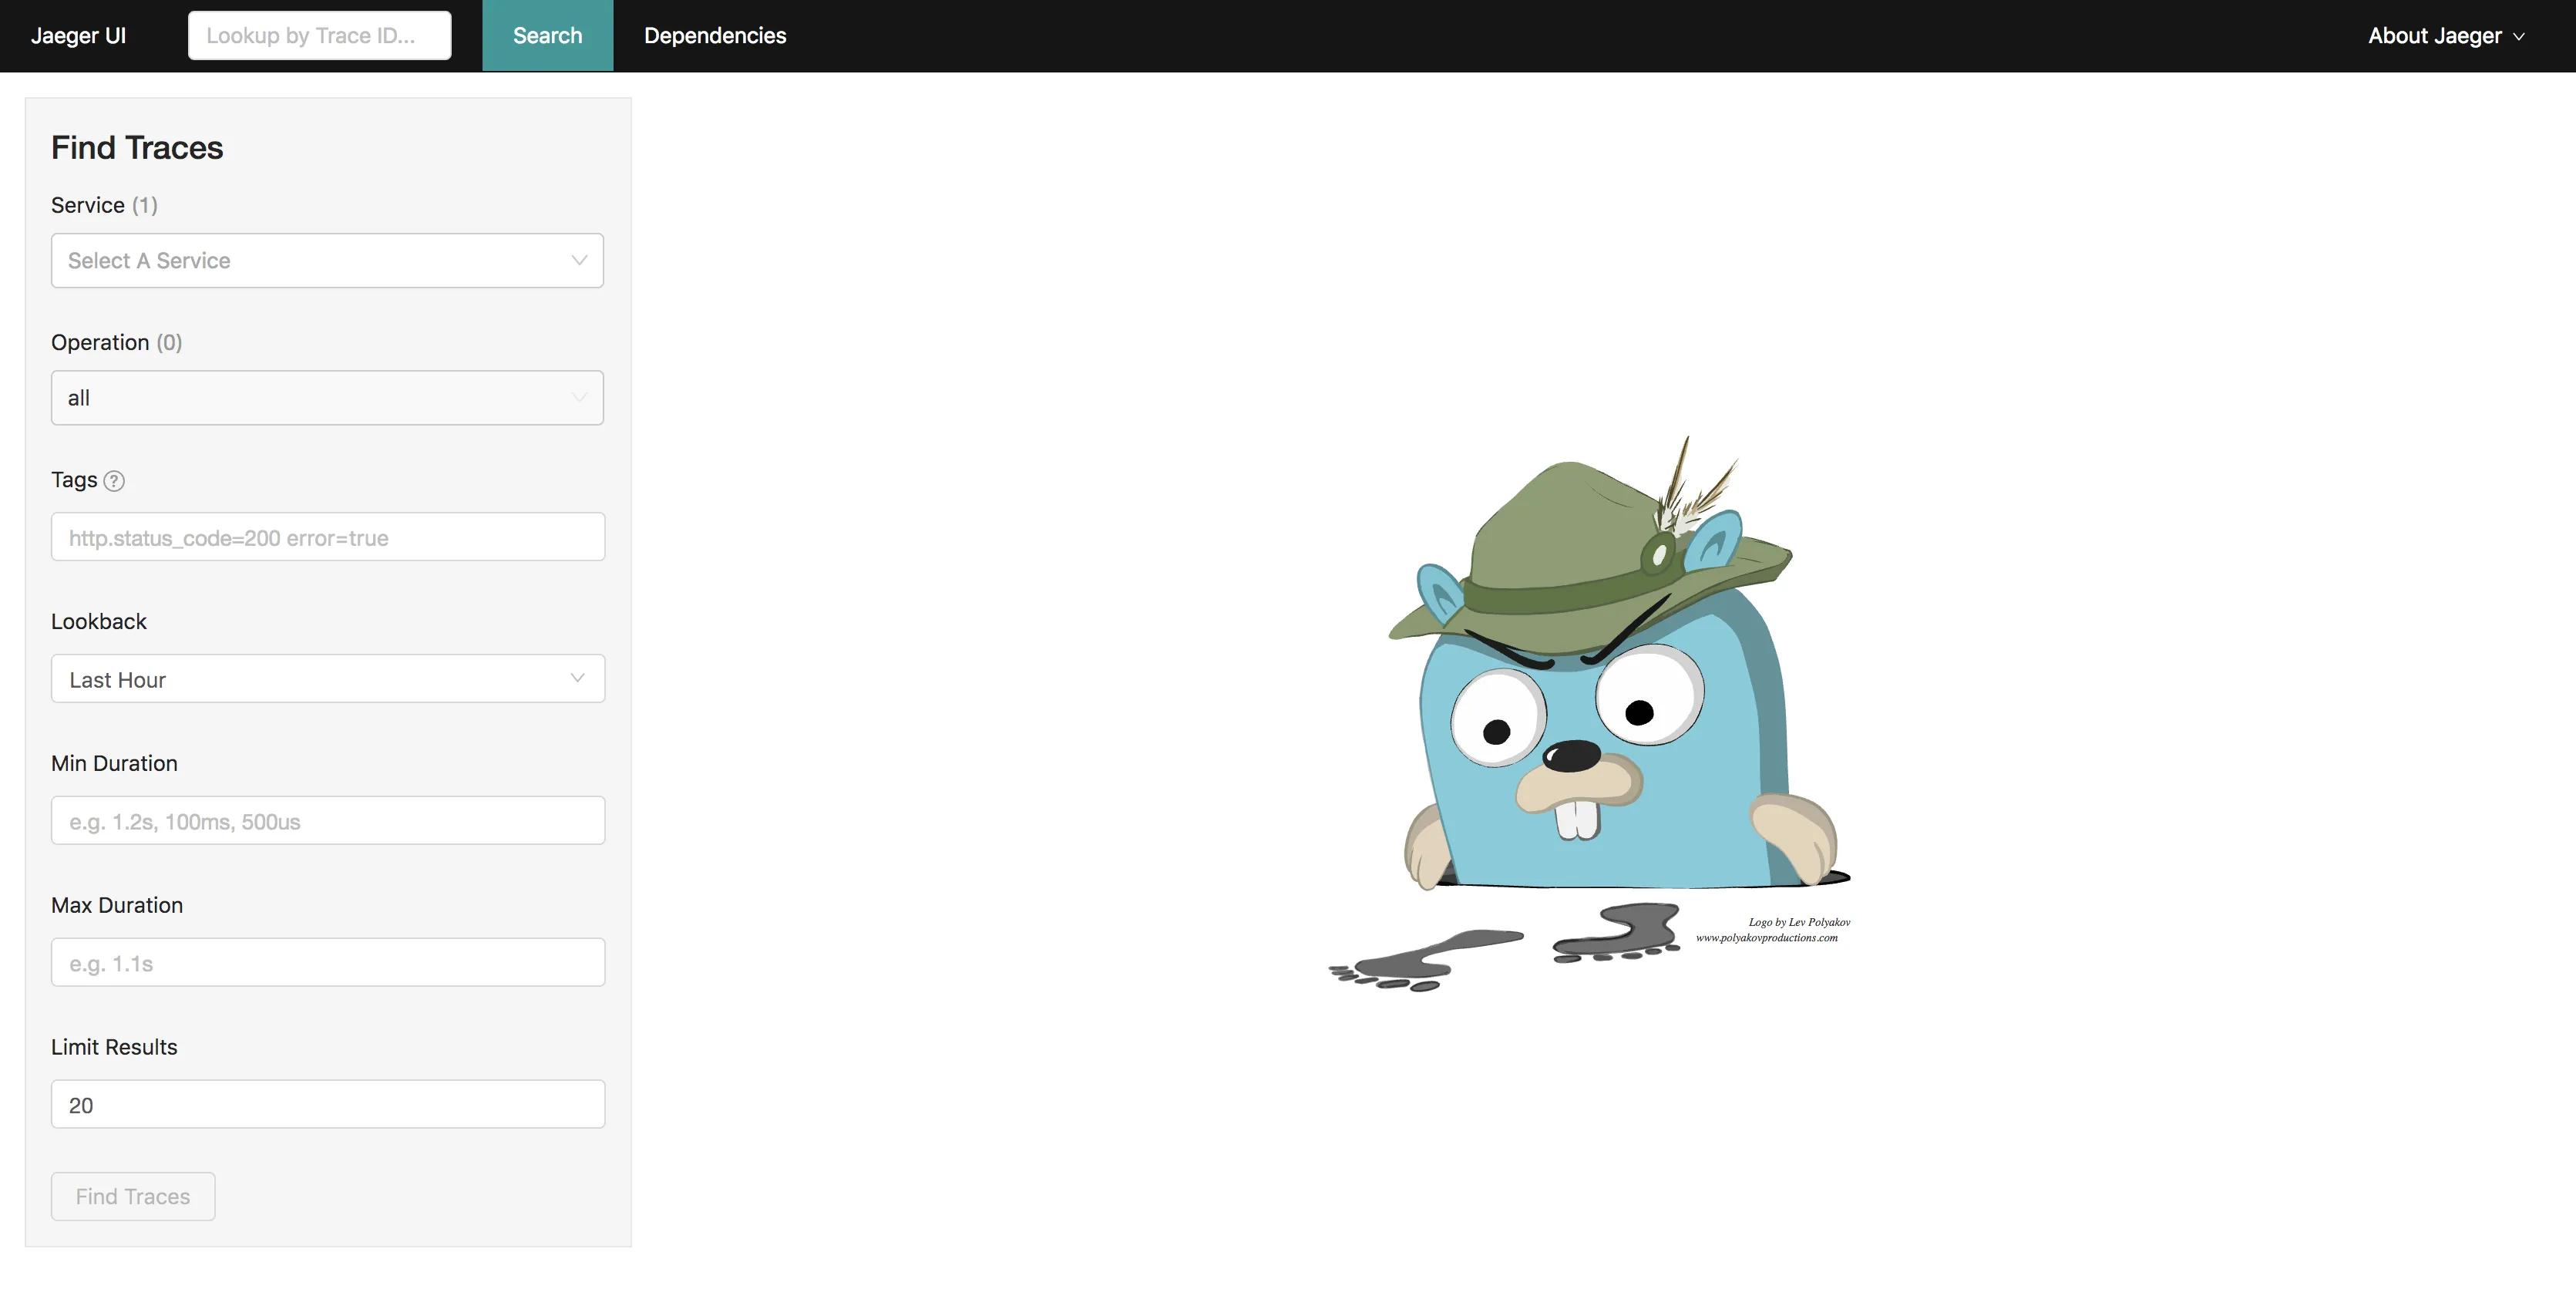
View Traces
Let us find the port Jaeger is exposed on by running the following command:
1kubectl -n istio-system get svc tracing
You can click on the link at the top of the page which maps to the right port and it will open Jaeger UI in a new tab.


