

Observability
Linkerd Telemetry and Distributed Tracing
Linkerd Telemetry
Linkerd's telemetry and monitoring features function automatically, without requiring any work on the part of the developer.
We have already looked at Linkerd Telemetry, not by name but by concept. Using stat, top and tap is one of the major and characteristic feature which Linkerd offers out of the box. All of this metrics are also accessible through Grafana Dashboard which Linkerd provides.
Expose Grafana dashboard:
1linkerd dashboard &
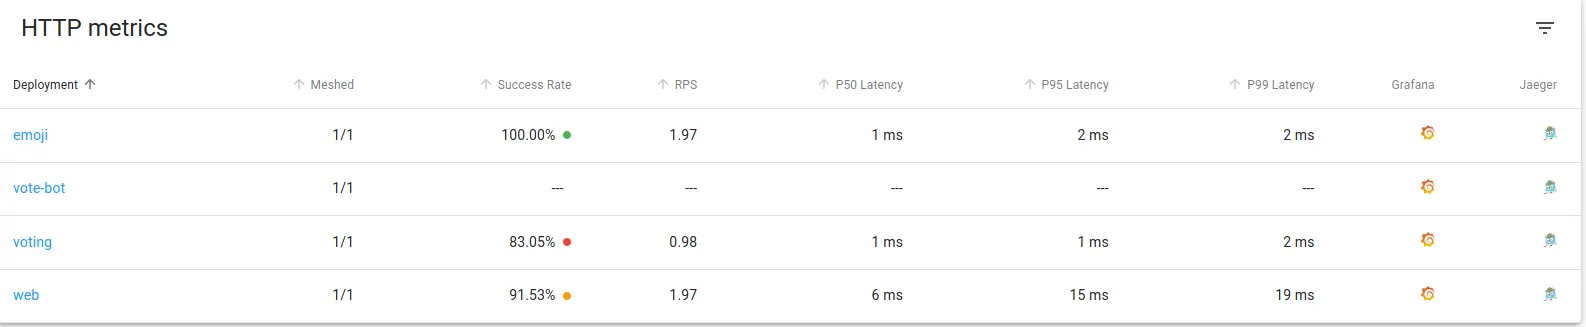
- Start
linkerd dashboard& navigate over the service you would want to see Grafana Dashboard for. - In the last column, click of the
Grafana Iconto access the metrics dashboard for the following deployment.
Distributed tracing with Linkerd
Linkerd added support for Distributed Tracing, which means that if your application has enabled tracing based on B3 Propagation, Linkerd proxies would automatically recognize that (as the trace-id is propagated through http headers) and send their spans, provided that the proxies are configured regarding the meshed trace collector endpoint.
To enable tracing onto your cluster :
1cat >> config.yaml << EOF2tracing:3 enabled: true4EOF
This configuration file can also be used to apply Add-On configuration (not just specific to tracing Add-On).
Let us apply that configuration to the linkerd upgrade command using the --addon-config flag and pipe that output to kubectl apply.
1linkerd upgrade --addon-config config.yaml | kubectl apply -f -
Before moving onto the next step, make sure everything is up and running with kubectl:
1kubectl -n linkerd rollout status deploy/linkerd-collector2kubectl -n linkerd rollout status deploy/linkerd-jaeger
Configure your sample application
Apply the tracing configuration to the emojivoto application:
1kubectl -n emojivoto patch -f https://run.linkerd.io/emojivoto.yml -p '2spec:3 template:4 metadata:5 annotations:6 config.linkerd.io/trace-collector: linkerd-collector.linkerd:556787 config.alpha.linkerd.io/trace-collector-service-account: linkerd-collector8'
Before moving onto the next step, make sure everything is up and running with kubectl:
1kubectl -n emojivoto rollout status deploy/web
The above command enables tracing in the linkerd proxies but the application containers still don’t have it enabled. Tracing can be enabled in the sample application can be enabled by
To enable tracing in emojivoto, run:
1kubectl -n emojivoto set env --all deploy OC_AGENT_HOST=linkerd-collector.linkerd:55678
Explore Jaeger
Now, you can port-forward the linkerd-jaeger service to checkout the traces.
1kubectl -n linkerd port-forward svc/linkerd-jaeger 16686:16686
Now let's explore traces of the vote-bot endpoint:

So, As you can see there are spans of the linkerd-proxy. For each request between two meshed components, you can see there are four linkerd-proxy spans.
The first two spans would be the spans sent from the proxy of the client component and will be marked as outbound. Again, in these two spans, the first one is the span of the application -> proxy, and the second one is the proxy->otherside. They are differentiated by the server and client tags respectively.
Jaeger and Linkerd
In Linkerd, as told above Grafana Integration is present in the `linkerd-web` ui through which which you can directly jump onto the dashboards of any workload like deployment, pod, etc.
Linkerd has done similar thing with Jaeger, if you have tracing enabled, if you navigate the Linkerd Dashboard, you should see a Jaeger icon on the right.
Cleanup the tracing components
1kubectl delete ns tracing emojivoto


