

Linkerd Dashboard
Introduction to Linkerd Dashboard
The Dashboard provides a clickable user interface for administration of Linkerd. The Dashboard provides measurements of success rate, requests/second and latency for services on the mesh. Run the Linkerd Dashboard, by executing:
1linkerd dashboard &
This command port-forwards from your local system to the linkerd-web service. You can also expose the dashboard using Kubernetes ingress, which we will see later in this section.
Since Linkerd's control plane components have the Linkerd proxy sidecarred, you can examine statistics of the traffic you are generating by looking at the dashboard. Execute:
1linkerd -n linkerd top deploy/linkerd-web
Exposing the dashboard
Instead of using linkerd dashboard & every time you'd like to see what's going on, you can expose the dashboard via an ingress. We will use the Nginx ingress, which we had deployed and used in Lab 3.
We will be applying Nginx ingress-traffic rule with basic authentication protocol
1apiVersion: v12kind: Secret3type: Opaque4metadata:5 name: web-ingress-auth6 namespace: linkerd7data:8 auth: YWRtaW46JGFwcjEkbjdDdTZnSGwkRTQ3b2dmN0NPOE5SWWpFakJPa1dNLgoK9---10apiVersion: extensions/v1beta111kind: Ingress12metadata:13 name: web-ingress14 namespace: linkerd15 annotations:16 kubernetes.io/ingress.class: "nginx"17 nginx.ingress.kubernetes.io/upstream-vhost: $service_name.$namespace.svc.cluster.local:808418 nginx.ingress.kubernetes.io/configuration-snippet: |19 proxy_set_header Origin "";20 proxy_hide_header l5d-remote-ip;21 proxy_hide_header l5d-server-id;22 nginx.ingress.kubernetes.io/auth-type: basic23 nginx.ingress.kubernetes.io/auth-secret: web-ingress-auth24 nginx.ingress.kubernetes.io/auth-realm: "Authentication Required"25spec:26 rules:27 - host: dashboard.example.com28 http:29 paths:30 - backend:31 serviceName: linkerd-web32 servicePort: 8084
This exposes the dashboard at dashboard.example.com and protects it with basic auth with credentials admin,admin.
From here you may need to modify your resolv.conf to add dashboard.example.com to localhost or use an alternative approach in order to see the dashboard deployment. We will not cover this in the workshop.
Tools exposed by dashboard
Linkerd dashboard exposes various CLI tools which may come handy while you debug your application running on mesh.
Mainly there are three tools which Linkerd exposes as an extension to it's CLI commands
stat
This will show the “golden” metrics for each deployment:
- Success rates
- Request rates
- Latency distribution percentiles
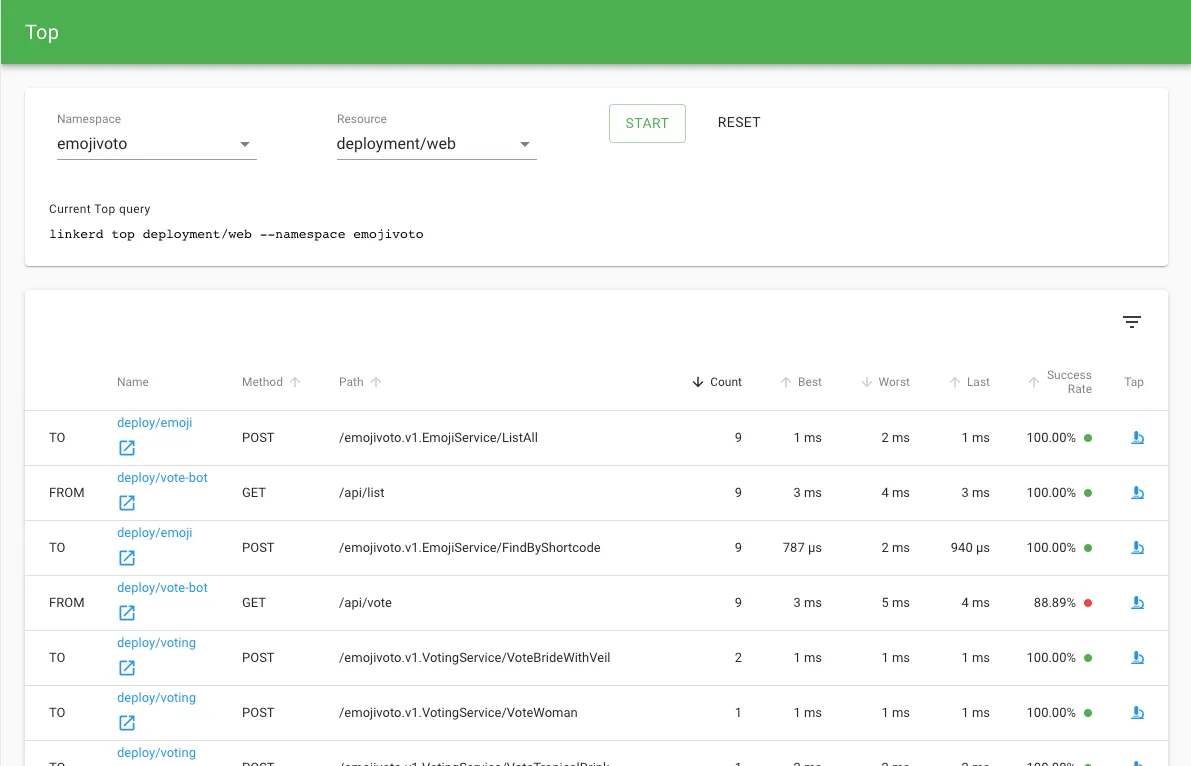
top
To get a real-time view of which paths are being called.
{" "}
tap
Shows the stream of requests across a single pod, deployment, or even everything in the emojivoto namespace.
{" "}


