Prometheus

Prometheus with Meshery

Meshery provides performance reports, including performance test results, node resource metrics etc. so that operators may easily understand the overhead of their service mesh’s control plane and data plane in context of the overhead incurred on nodes running within the cluster. In order to generate performance test reports of service meshes and their workloads, Meshery uses Grafana and/or Prometheus as visualization and metrics systems, respectively. This guide outlines the requirements necessary for Meshery to connect to these systems. The steps may vary depending upon the service mesh and its configuration.

Features

  • Native support for PromQL
  • Create custom charts with your own Prometheus queries
  • Keep charts in-sync with Mesherys panel viewer

Overview

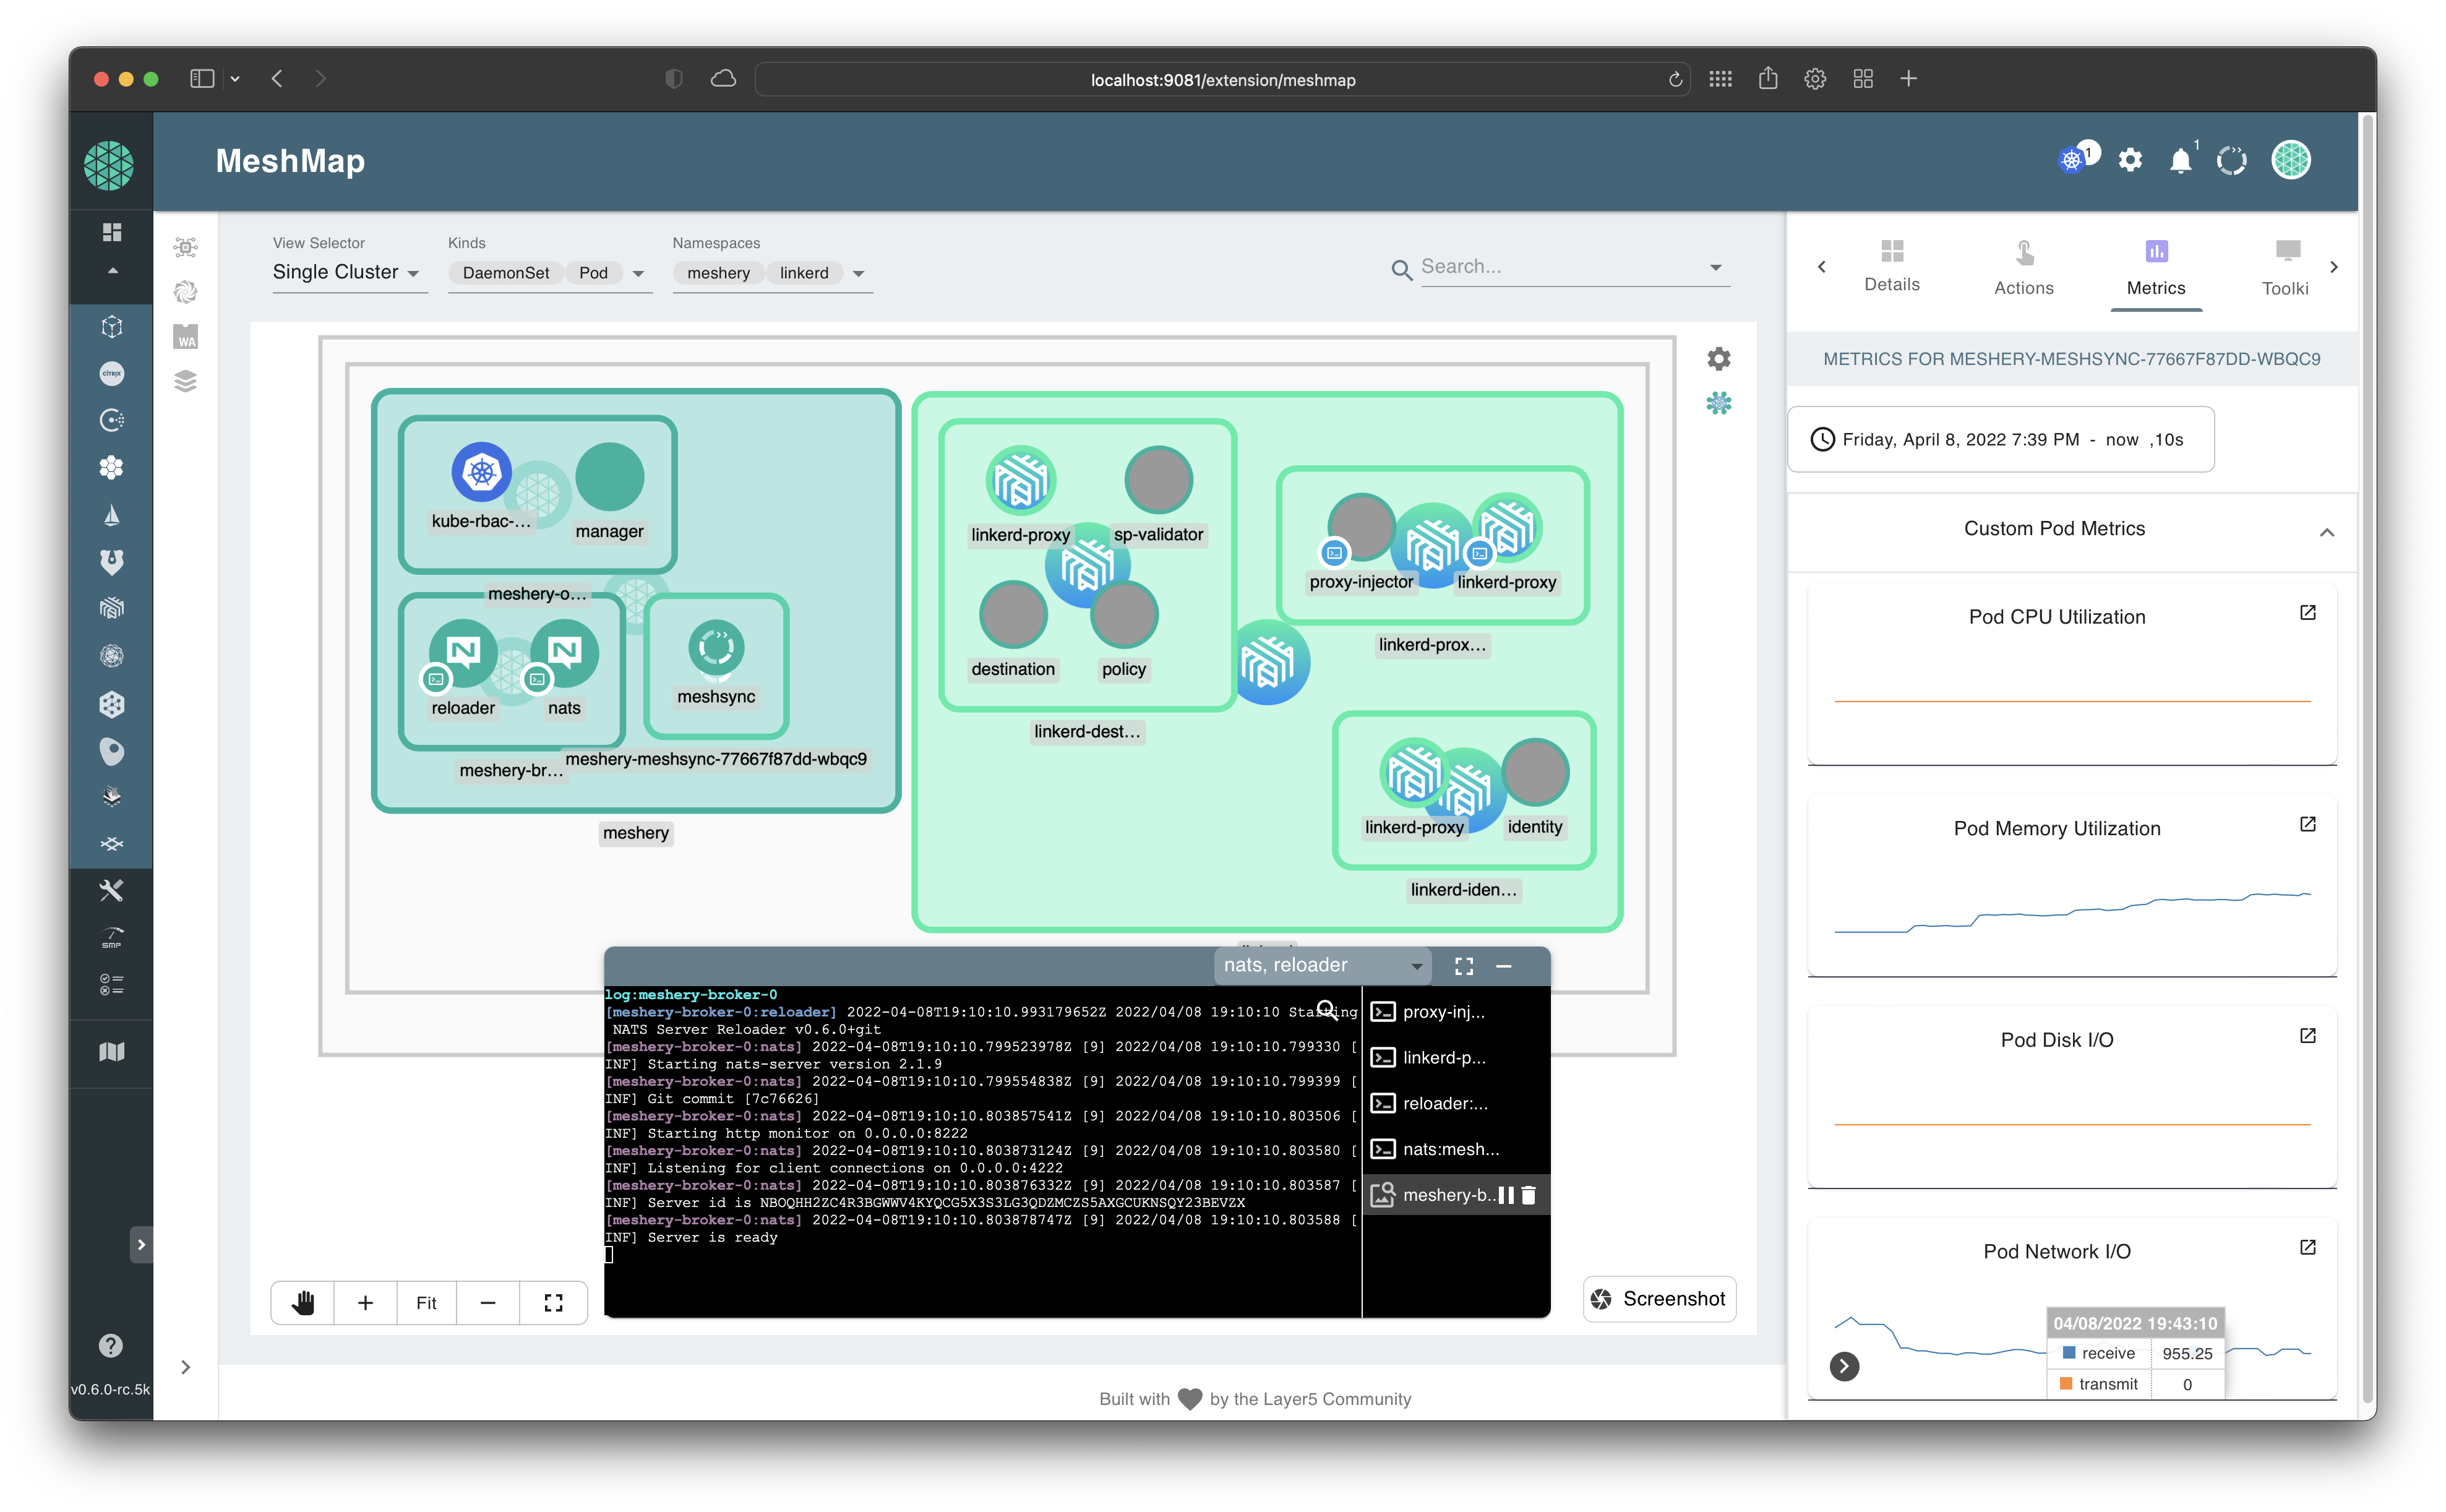
The Prometheus monitoring system and time series database.

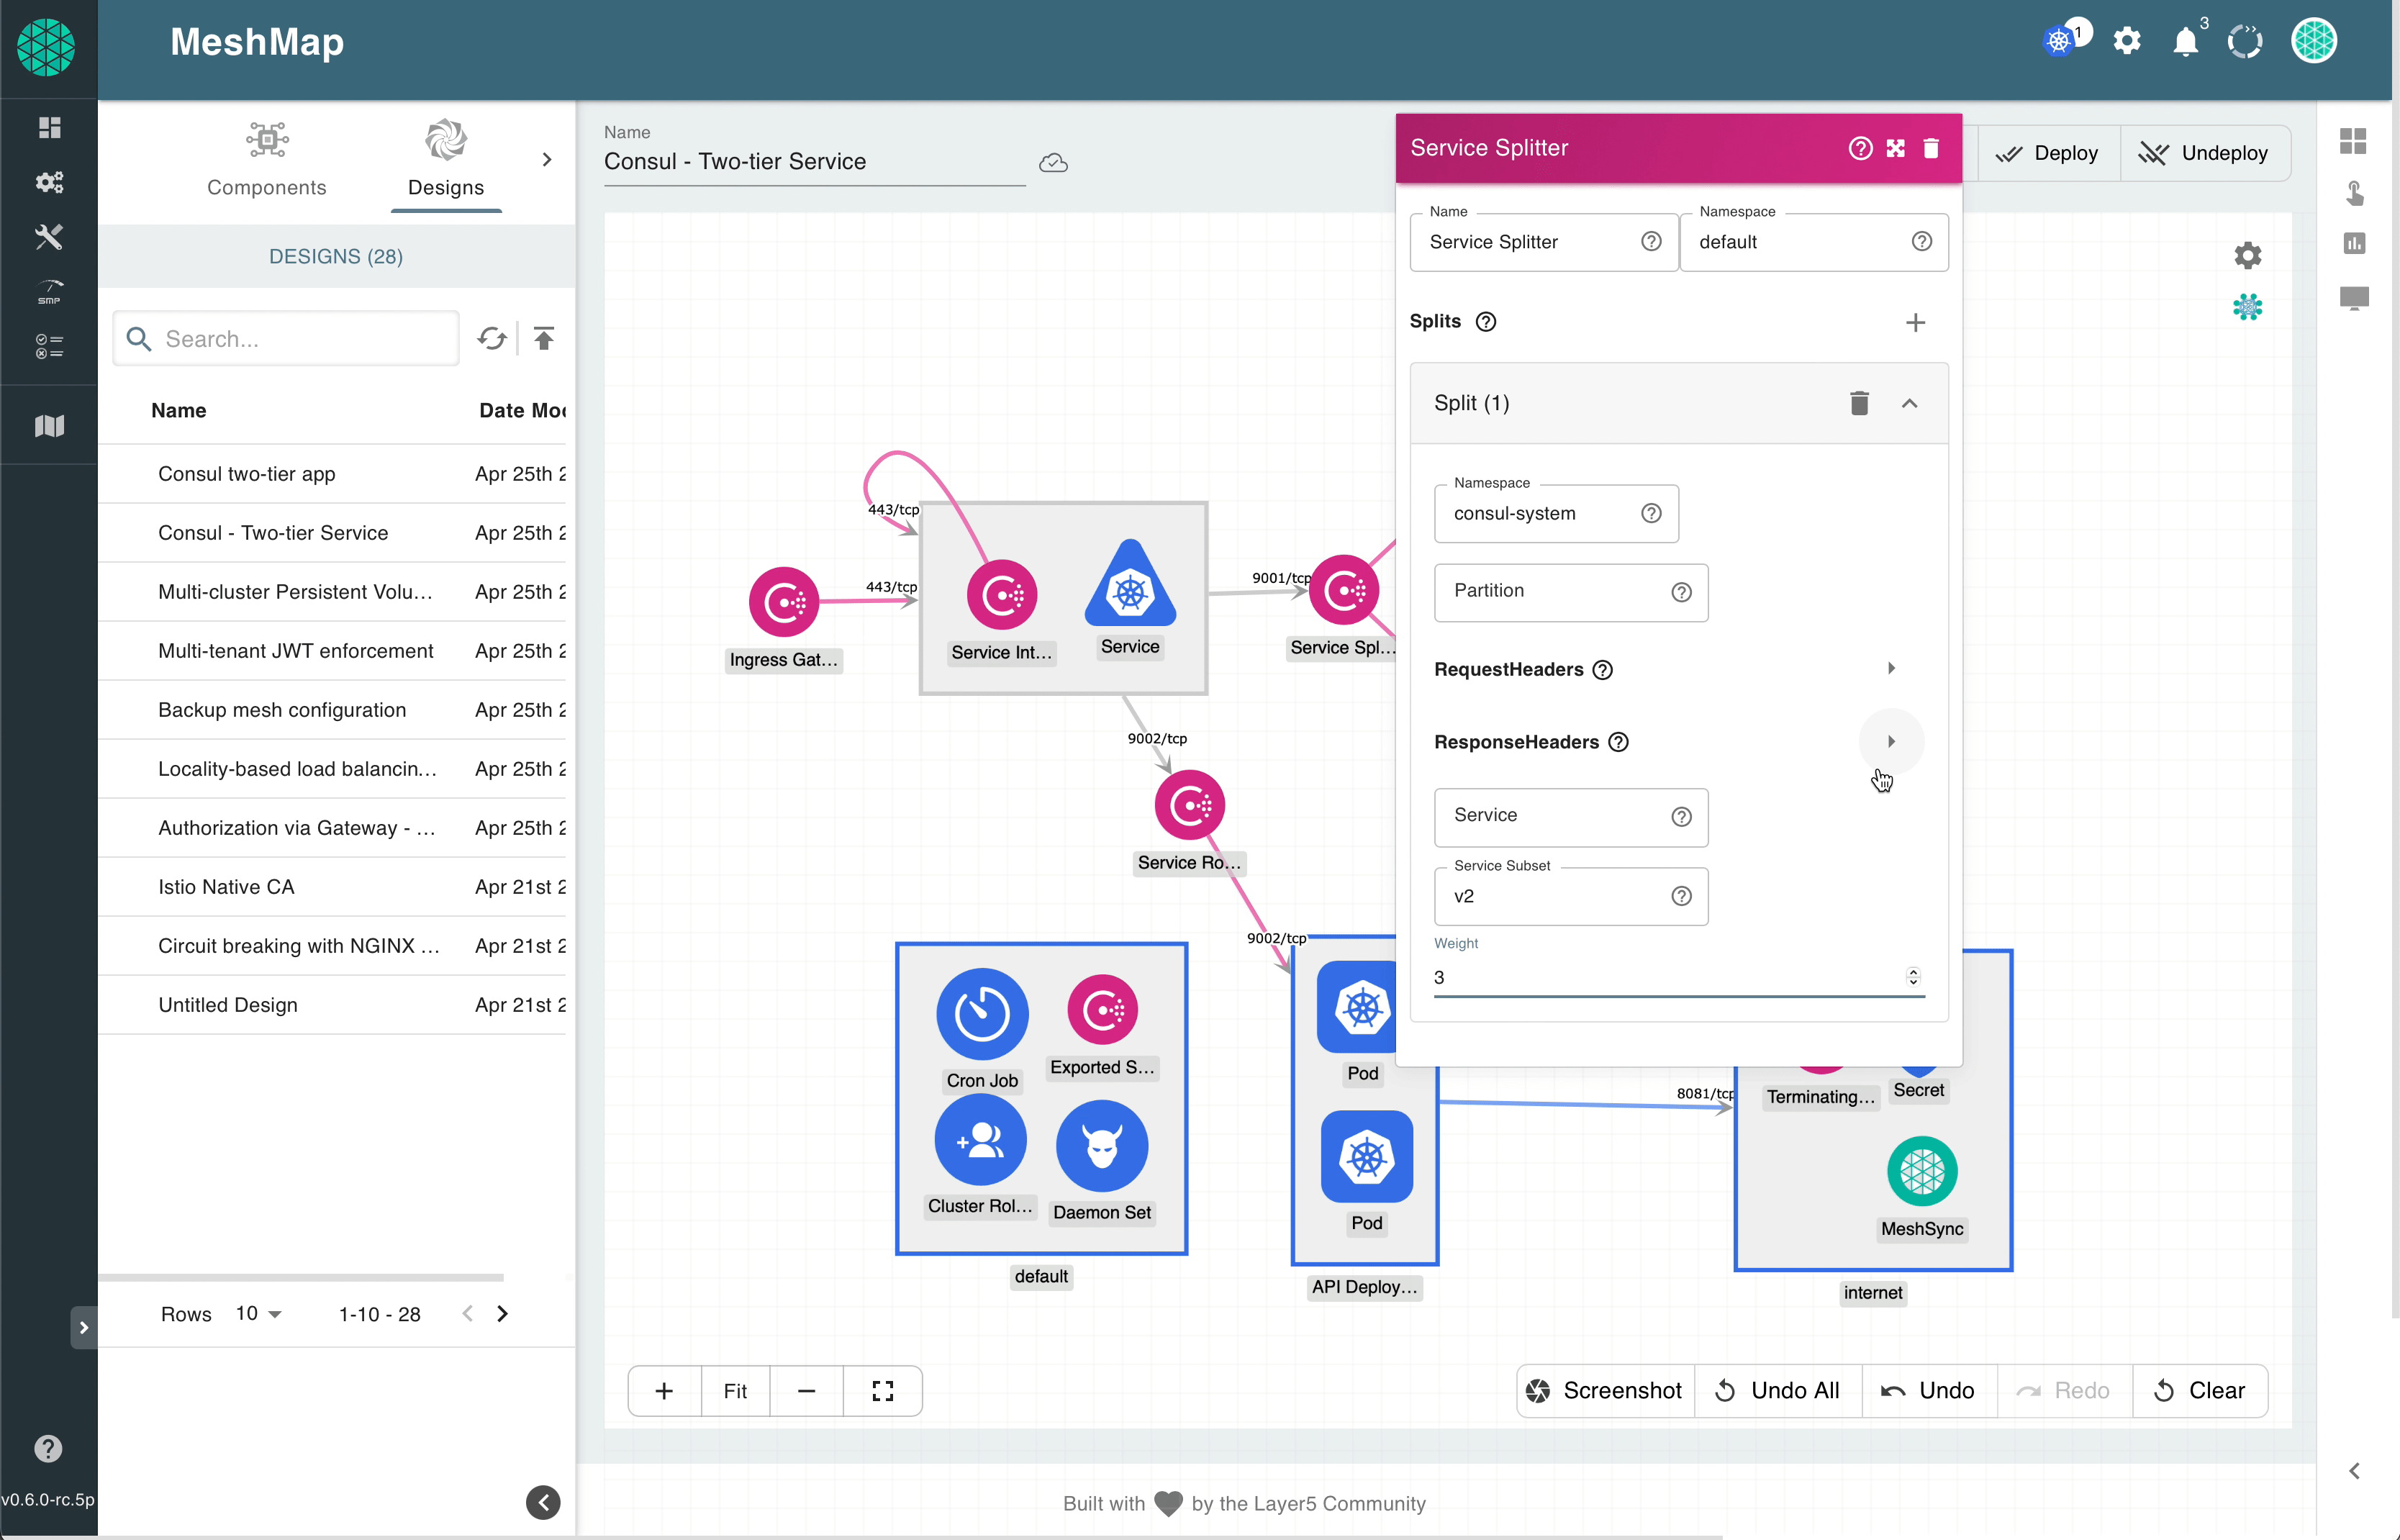
Collaboratively and visually diagram your cloud native infrastructure with GitOps-style pipeline integration. Design, test, and manage configuration your Kubernetes-based, containerized applications as a visual topology.

Looking for best practice cloud native design and deployment best practices? Choose from thousands of pre-built components in MeshMap. Choose from hundreds of ready-made design patterns by importing templates from Meshery Catalog or use our low code designer, MeshMap, to create and deploy your own cloud native infrastructure designs.

See Documentation

Kubernetes Orchestration and Diagramming software

Orchestrate and design Kubernetes architecture diagrams easily with predefined templates and symbols designed for professionals.

  • Performance Icon
    Extensive library of integrations
  • Configuration Icon
    Infrastructure orchestration
  • Performance Icon
    Multi-player editing
  • Performance Icon
    Ready-to-use templates
  • Configuration Icon
    Visual drag & drop
  • Performance Icon
    Operate with No Code

How it Works

See It in Action

Better together - Prometheus with Meshery

Meshery provides performance reports, including performance test results, node resource metrics etc. so that operators may easily understand the overhead of their service mesh’s control plane and data plane in context of the overhead incurred on nodes running within the cluster. In order to generate performance test reports of service meshes and their workloads, Meshery uses Grafana and/or Prometheus as visualization and metrics systems, respectively. This guide outlines the requirements necessary for Meshery to connect to these systems. The steps may vary depending upon the service mesh and its configuration.

Collaboratively manage infrastructure with your coworkers synchronously sharing the same designs.

Slide 1
  • Slide 0
  • Slide 1

Related Integrations

270+ Built-In Integrations

Support for your Cloud Native Infrastructure and Apps

All (263)

App Definition and Development (67)

Provisioning (42)

Cloud Native Network (32)

Runtime (12)

Orchestration & Management (18)

    Layer5, the cloud native management company

    An empowerer of engineers, Layer5 helps you extract more value from your infrastructure. Creator and maintainer of cloud native standards. Maker of Meshery, the cloud native manager.