7 Key Considerations for Microservices-Based Application Delivery
Ensuring the Success of Your Cloud Native Journey
The Role of Application Delivery in Your Cloud Native Journey
As digital transformation is changing how your organization conducts business, so is it changing how your products and services are delivered. The infrastructure and practices by which your software is continuously deployed and operated — your application delivery — is the fulcrum of your organization’s digital transformation. Likely you are progressing on your cloud native journey — that is, transitioning from monolithic to container-based microservices architectures with the goal of achieving agility, portability, and on-demand scalability. Kubernetes is the platform of choice for many, providing the automation and control necessary to manage microservices-based applications at scale and with high velocity.
With the network part and parcel to each and every service request in your microservices-based application, it may come as no surprise that at the core of application delivery is your application delivery controller, an intelligent proxy that accelerates and manages application delivery. With no standard definition of what an application delivery controller does, the capabilities of intelligent proxies vary broadly. And so in this white paper, we’ll explore application delivery controllers as they relate to your architecture choices, your use of Kubernetes platforms, and open source tools.
7 Key Considerations for Microservices-Based Application Delivery
Before embarking on your cloud native journey, it is essential to critically assess your organization’s readiness with regard to skill set so that you can choose the solutions that best fit the business objective you are seeking to meet in context of your ability to do so. There are seven key considerations to address when planning your microservices-based application delivery design:
- Architecting your foundation the right way
- Openly integrating with the cloud native ecosystem
- Choosing the perfect proxy
- Securing your applications and APIs
- Enabling CI/CD and canary deployment with advanced traffic steering
- Achieving holistic observability
- Managing monoliths and microservices
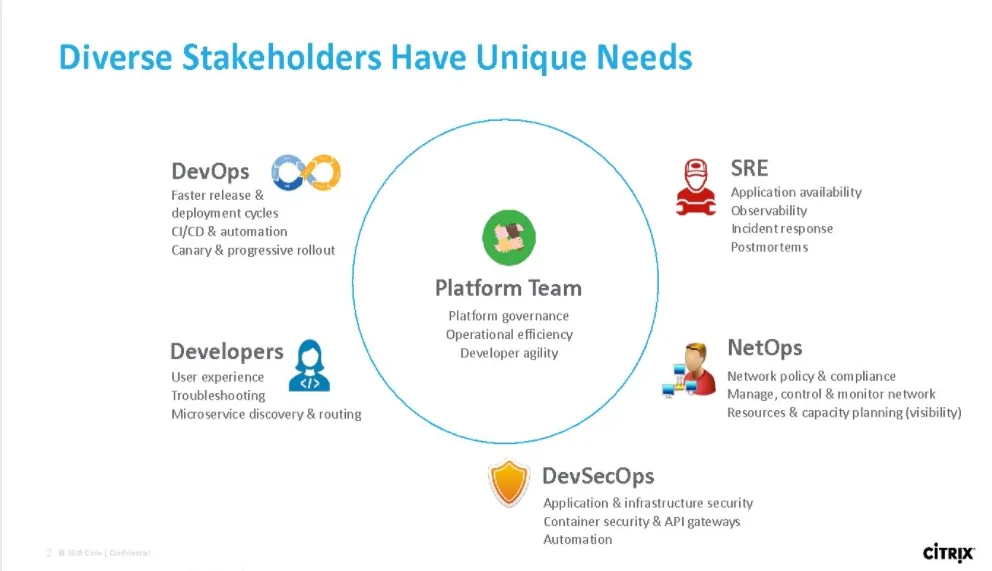
A thorough evaluation of these seven considerations is best done with specific tasks and goals in mind. Depending on the size and diversity of your organization, you may need to account for a variety of stakeholders’ needs — that is, tasks and goals that differ based on role and responsibility. In context of application delivery, let’s survey the most common roles with a generalized view of their responsibilities and needs as stakeholders. To help facilitate a general understanding, we’ve grouped some roles when responsibilities overlap across multiple teams:
Platform
Platform teams are responsible for deploying and managing their Kubernetes infrastructure. They are responsible for platform governance, operational efficiency, and developer agility. The platform team is the connective tissue among various teams like DevOps, SREs, developers, and network operations teams and therefore must address and balance the unique needs of a diverse group of stakeholders, or influencers, when choosing cloud native solutions.
DevOps
DevOps teams are responsible for continuously deploying applications. They care about faster development and release cycles, CI/CD and automation, and canary and progressive rollout.
SREs
Site reliability engineers must ensure application availability. They care about observability, incident response, and postmortems. SREs often act as architects for DevOps team and as such are often extensions of or directly belong to DevOps teams.
Developers
Development teams are responsible for application performance and are focused on ensuring a seamless end-user experience, including troubleshooting and microservices discovery and routing. Application performance and troubleshooting is shared responsibility among multiple teams.
NetOps
Network operations teams are responsible for ensuring stable, high-performing network connectivity, resiliency, security (e.g. web application firewalls and TLS), and are commonly focused on north-south traffic. They care about establishing networking policies and enforcing compliance; achieving management, control, and monitoring of the network; and gaining visibility for the purpose of resources and capacity planning.
DevSecOps
DevSecOps teams care about ensuring a strong security posture and rely on automated tools to orchestrate security for infrastructure, applications, containers, and API gateways. DevSecOps works very closley with NetOps team for holistic secure posture.
Each role has nuanced responsibilities. Whether you have a single person or teams of people assigned to these roles, each role’s function needs to be accounted for.
It’s important to note that these stakeholders are undergoing a transformation in their responsibilities — or at least a transformation in the way in which they perform their responsibilities. Depending upon your organization’s size and structure, your stakeholders may have clearly defined lines of accountability or not among roles. As you adopt a cloud native approach to application deployment and delivery, you may find that the once-defined lines have blurred or that they are being redrawn. Be aware that the individuals who fill these roles typically go through a period of adjustment that can be unsettling until they adapt to their own and their teams’ new identities.
Your cloud native infrastructure should be as accommodating as possible to you, your team, and your collective responsibilities and process, so we encourage you to seek solutions that address the needs of all your stakeholders. Significantly, this includes evaluating different architectural models for as best fit for purpose. While every organization doesn’t travel the same road to cloud native, every journey starts with initial architectural decisions – decisions which have substantial bearing on your path to cloud native.
Architecting Your Foundation the Right Way
Cloud native novices and experts alike find that designing their application delivery architectures is the most challenging part of building microservices. Your architectural choices will have a significant impact on your cloud native journey. Some architectures will provide greater or fewer benefits while others will prove less or more difficult to implement.
Whether you are a cloud native pro or a novice, your selection of the right application delivery architecture will be one that balances the tradeoff between the greatest benefits and the simplicity needed to match your team’s skill set. Figure 1 highlights four common application delivery architecture deployment models:

Tip: Traffic Directions
North-south (N-S) traffic refers to traffic between clients outside the Kubernetes cluster and services inside the cluster, while east-west (E-W) traffic refers to traffic between services inside the Kubernetes cluster.
Each of the deployment models in Figure 1 come with their list of pros and cons and are typically the point of focus of different teams. So how do you choose the right architecture for your deployment? Given the needs of your stakeholders and the many specifics involved in managing both north-south (N-S) and east-west (E-W) traffic, it is critical to assess the four different architectures with respect to the following areas:
- Application security
- Observability
- Continuous deployment
- Scalability and performance
- Open source tools integration
- Service mesh & Istio integration
- IT skill set required
Let’s examine each of the four deployment models.
Two-Tier Ingress

Two-tier ingress is the simplest architectural model to deploy to get teams up and running quickly. In this deployment model, Tthere are two layers of ADCs for N-S traffic ingress. The external ADC (at Tier 1), shown in green in Figure 2, provides L4 traffic management. Frequently, additional services are assigned to this ADC and can include web application firewall (WAF) and, secure sockets layer/transport layer security offload (SSL/TLS) functionality and authentication. A two-tier ingress deployment model is often managed by the existing network team (which is familiar with internet-facing traffic), and it can also be used as an ADC for other existing applications simultaneously.
The second ADC (Tier 2), shown in yellow in Figure 2, handles L7 load balancing for N-S traffic. It is managed by the platform team and is used within the Kubernetes cluster to direct traffic to the correct node. Layer 7 attributes, like information in the URL and HTTP headers, can be used for traffic load-balancing decisions. The yellow ADC continuously receives updates about the availability and respective IP addresses of the microservices pods within the Kubernetes cluster and can make decisions about which pod is best able to handle the request. Deployed as a container inside the Kubernetes cluster, the yellow ADC can be deployed as a container with Citrix CPX or with another similar product.
The E-W traffic between microservices pods is managed by kube-proxy, an open source, basic L4 load balancer with simple IP address-based round robin or least connection algorithm. kube-proxy lacks advanced features like Layer 7 load balancing, security, and observability, making it a blind spot for E-W traffic.
Pros of Two-Tier IngressWith the right proxy, SSL termination can be done at the edge, and traffic can be inspected easily. This enables N-S traffic to be comprehensively secured across L3-7. ADC collects and reports telemetry on the N-S application traffic it sees, which means that this architecture provides robust observability for N-S traffic. ADC can also also integrate with CI/CD tools like Spinnaker to provide traffic management to N-S traffic for excellent continuous deployment capabilities.
Two-tier ingress scales very well for N-S traffic, as an example Citrix ADC reach hundreds of Gbps or even Tbps throughput through active-active clustering of ADCs if required. Integration with third-party tools like Prometheus, Grafana and Zipkin are supported out of the box with ADC, so you can continue to use the tools with which you are familiar to collect data and manage your systems for N-S traffic.
The bifurcated design of two-tier ingress makes it relatively simple to implement demarcation points for control. The network team can own and manage the green ADC, and the platform team can work inside the Kubernetes environment. Neither the network team nor the platform team needs extensive retraining, which makes this architecture quick to implement.
Cons of Two-Tier IngressThe limitations of kube-proxy have made the use of third-party tools like Project Calico necessary to provide network policies, segmentation, and security support for inter-microservices communication. Similarly, kube-proxy's lack of detailed telemetry capabilities provides very little observability for E-W traffic. kube-proxy does not have the extensive APIs to integrate with continuous deployment tools, and its basic round-robin load balancing does not provide the granular load balancing needed to incorporate a CI/CD strategy inside the cluster. In general so you lack advanced load balancing tool set required to manage your inter-pod traffic. And kube-proxy does not currently integrate with service meshes, so there is no open source control plane integration for your E-W traffic management.
Overall, two-tier ingress provides excellent services for N-S traffic but lacks control for E-W traffic. It is a popular architecture because it is simple to implement and is frequently a starting point for enterprises on their cloud native journey to microservices adoption.
Unified Ingress

Unified ingress is very similar to the two-tier ingress architecture, except that it unifies two tiers of application delivery controllers (ADCs) for N-S traffic into one. Reducing an ADC tier effectively removes one hop of latency for N-S traffic.
Unified ingress has the same benefits and drawbacks as the two-tier ingress proxy architecture for security, observability, continuous deployment, scale and performance, open source tools support, and service mesh integration. Where it differs is in the skill sets required for implementation. With unified ingress, both the ADCs for N-S traffic and kube-proxy for the E-W traffic are managed by the platform team, who must be very network savvy to implement and manage this architecture.
A unified ingress proxy architecture is capable of participating in the Kubernetes cluster’s overlay network. This allows it to communicate directly with the microservices pods. Therefore, the platform team has to be knowledgeable about layers 3-7 of the network stack to take full advantage of this architecture.
In summary, unified ingress proxy architecture is moderately simple to deploy compared to service mesh (which we will cover next), and it offers robust capabilities for N-S traffic, but has very limited functionality for E-W traffic due to the limitations of kube-proxy. A network-savvy platform team is key for implementing this architecture.
Service Mesh
A service mesh is a dedicated infrastructure layer to control how different parts of an application communicate with one another with one another. The service mesh landscape has exploded because service meshes offer the best observability, security, and fine-grained management for traffic among microservices — that is, for E-W traffic. As an additional layer of infrastructure, service meshes do bear additional complexity as a tradeoff to the value they provide.

A typical service mesh architecture is similar to the two-tier ingress proxy architecture for N-S traffic and offers the same rich benefits for N-S traffic. The key difference between service mesh and two-tier ingress, and where most of the value lies, is that service mesh employs a lightweight proxy as a sidecar to each microservice pod for E-W traffic. Microservices do not communicate directly: Communication among microservices happens via the sidecar, which enables inter-pod traffic to be inspected and managed as it enters and leaves the pods.
By using proxy sidecars, service mesh offers the highest levels of observability, security, and fine-grained traffic management and control among microservices. Additionally, select repetitive microservice functions like retries and encryption can be offloaded to the sidecars. Despite each sidecar’s being assigned its own memory and CPU resources, sidecars are typically lightweight.
You have the option to use Citrix CPX as a sidecar. Sidecars, which are managed by the platform team and attached to each pod, create a highly scalable, distributed architecture, but they also add complexity because they result in more moving parts.
Pros of Service MeshThe advantages of service mesh for N-S traffic are similar to those for two-tier ingress. Service mesh, however, brings added advantages for E-W traffic.The presence of sidecars enables you to set security policies and control communication among your microservices. You can mandate things like authentication, encryption, and rate limiting for APIs among microservices if required.
Because E-W traffic is seen by the sidecars, there is much more telemetry to provide holistic observability for better insights and improved troubleshooting. Furthermore, Citrix CPX as a sidecar has well-defined APIs that integrate with myriad open source tools, so that you can use the observability tools you're used to. Sidecar APIs allow integration with CI/CD tools like Spinnaker.
Similarly, sidecars will integrate with a service mesh control plane like Istio for E-W traffic. Additionally, repetitive functions like retries and encryption can be offloaded to the sidecars. The distributed nature of the sidecar means that the solution is scalable for such features as observability and security.
Cons of Service MeshThe biggest drawback of a service mesh architecture is the complexity of implementation (managing hundreds or thousands of sidecars is not trivial). The learning curve can be steep for the platform team because there are so many moving parts. A sidecar for every pod adds to CPU and memory needs. Similarly, sidecars add latency. Latency, which may affect application performance, varies with proxy implementation and can be easily measured by the open source tool, Meshery. Citrix CPX as a sidecar offers latency as low as 1ms, whereas other solutions can add much more.
Overall, a service mesh architecture provides excellent security, observability, and fine-grained traffic management for all traffic flows. The major downside is that it is complex to implement and manage.
Service Mesh Lite

What if you want service mesh-like benefits with much less complexity? The answer is service mesh lite, which is a variant of service mesh.
With a service mesh lite architecture, the ADC shown in green in Figure 5 is responsible for Layer 4-7 load balancing for N-S traffic to handle inbound requests and load balance to the right Kubernetes cluster. The green ADC may carry out SSL termination, web application firewalling, authentication, or other network services. It is managed by the networking team.
Depending on isolation and scale requirements, service mesh lite proxy architecture uses a single or several ADCs (shown in yellow in Figure 5) that proxy communications among microservices pods to manage inter-pod (E-W) traffic rather than using individual sidecars attached to each pod. Proxies can be deployed per node or per namespace and are managed by platform teams.
Pros of Service Mesh LiteService mesh lite provides many of the same benefits as service mesh but reduces the overall complexity by only having a small set of proxy instances per cluster to manage the inter-pod traffic. Passing all E-W traffic through a small set of proxies provides the same advanced policy control, security, and fine-grained traffic management of a service mesh proxy architecture without all the complexity.
Another advantage of service mesh lite is reduced latency as compared to service mesh because end user request goes through fewer proxies. The main advantage is reduced complexity and the lower skill set required to implement compared to service mesh. Similar to two-tier ingress, the networking team can manage the green ADC, and the platform team can manage the yellow ADC. With service mesh lite, both teams can work in familiar environments and develop at their own speed.
Cons of Service Mesh LiteService mesh lite removes the implementation and management associated with service mesh, but the absence of a proxy per pod means that you sacrifice some functionality offload. For example, encryption for E-W must be implemented in each microservice, itself, if required.
Overall, service mesh lite provides most of the service mesh features but with reduced complexity and a lower IT skill set requirement. Many organizations who started with the two-tier ingress architecture find it an easy transition to service mesh lite for the added benefits it brings to their E-W traffic including better observability, enhanced security, better integration with open source tools, and support for continuous deployment.
So after reviewing the four architecture choices, you’re probably wondering: What ‘s the right architecture choice for my organization? There are no right or wrong answers. Like other architectural choices, proxy deployment models should be selected based on, in part, your application needs and your team structure and your team’s skill set.
Your model of proxy deployment is an important consideration, but just one of many when planning for your application delivery infrastructure. Ensuring that the application delivery components in your deployment are well-integrated into the cloud native ecosystem is your next consideration.
Openly Integrating with the Cloud Native Ecosystem
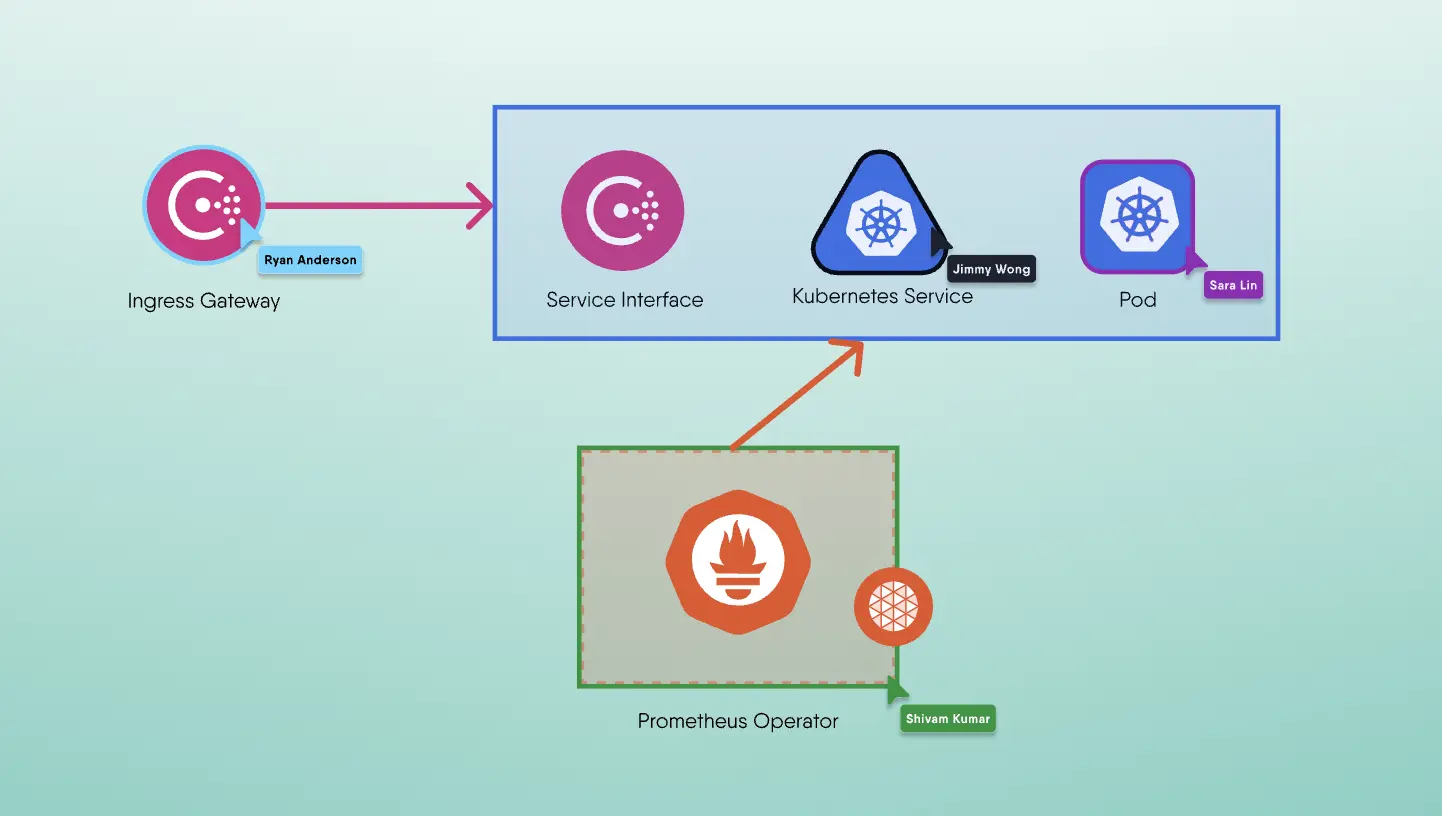
It’s imperative that your various application delivery tools and processes, including your proxy, be well-integrated into commonplace cloud native infrastructure. It’s no secret that much of today’s innovation happens in open source software. And clouds, both public and private, are built upon open source software. So in most cases, your infrastructure will be comprised of popular open source infrastructure and tools that you have picked up on your journey to cloud native. To the extent this is the case, you’ll find common integrations by categories in Figure below:

Figure - Key categories of consideration for proxy integration with Kubernetes platforms and open source tools
Cloud native environments make liberal use of open source software projects. Irrespective of which projects you use, suffice it to say that cloud native application delivery can’t be done with just containers. The combination of containers, container orchestration, and a service mesh will get you very far. And alongside a CI/CD system, these components are the most significant and ubiquitously used components of cloud native infrastructure. Integration with each of these categories of cloud native infrastructure is critical so that developers and operators can design and run systems that communicate and inter-operate as a whole. The fact that these bedrocks of cloud native infrastructure are open source unlocks their ability to be integrated.
At the heart of the cloud native ecosystem is the extensible and scalable orchestration infrastructure that is Kubernetes. The cloud native ecosystem (both open source and closed source) extends Kubernetes by writing custom resource definitions (CRDs) and associated controllers. The controllers and CRDs give operators a Kubernetes-native way to manage all parts of their platforms — both open source and closed source. This integration affords tool unification and powerful composable intent-based primitives that truly enable a software-defined platform.
Critical to the speed of delivery is an early investment in continuous integration/continuous delivery (CI/CD). It’s likely you have already wrangled continuous integration. Continuous deployment pipelines are your next step in seeing that changes to your source code automatically result in a new container being built and a new version of your microservice being tested and deployed to staging and eventually to production.
For many, the notion that CI/CD is an area of early investment is counterintuitive, and they find it hard to swallow the upfront engineering effort required to get a solid pipeline in place. The sooner CI/CD basics are implemented, however, the sooner the dividends start paying out. We will cover advanced continuous delivery considerations later in this white paper.
With cloud native infrastructure’s being inherently dynamic (in contrast to infrastructure not driven by APIs,) the ability to observe cloud native infrastructure and its workloads is also necessary. Software is written with functionality and debugging in mind. Most often, developers use logging as the primary method for debugging their applications. Integration with Elasticsearch and Kibana is key here.
Performance counters are another way to track application behavior and performance. Akin to SNMP for physical and virtual network monitoring, the equivalent cloud native “standard” is the use of Prometheus and Grafana, so it’s important that your application delivery solution integrate with these tools. Currently there is no recognized standard for cloud native application performance monitoring metrics.
OpenMetrics
The cloud native ecosystem needs a common format for the exchange of metrics. Observability pains grow with the release of each newly instrumented service that presents its own metric format. OpenMetrics is an effort to create an open standard for transmitting metrics at scale, with support for both text representation and protocolbBuffers. OpenMetrics builds on Prometheus’s exposition format, popular telemetry formats, and protocols used in infrastructure and application monitoring.
Irrespective of the metrics format, there are a few metrics that have been identified as key indicators of the health of a cloud native application (that is, the health of a service): latency, traffic, errors, and saturation. Your application delivery solution should assist in producing these signals as well as provide support for the tracing of your distributed, cloud native workloads.
The aforementioned integrations with open source tools enable loosely coupled systems that are resilient, manageable, and observable. Citrix ADC also embodies these characteristics. All of the infrastructure integrations detailed here depend upon APIs for interchange and interoperability. Cloud native applications, too, are centered around declarative APIs to interface with the infrastructure and serve user-facing workloads.
The endpoints that your APIs expose are now being managed by open source service meshes. Service meshes deliver the next generation of networking designed for cloud native applications. At the core of a service mesh is its data plane (its collection of proxies). Proxy selection criteria and deployment model tradeoffs are our next area of consideration.
Check out the topic Choosing the Perfect Proxy to learn more!