Analyzing Service Mesh Performance
Learn more about Service Mesh Performance from this article Analyzing Service Mesh Performance - Published in issue 3 of IEEE Bridge October 2021

As a forthcoming, ubiquitous layer of cloud native infrastructure, service meshes offer deep and uniform control and visibility into the topology and state of ephemeral microservices. Managing the myriad configurations of cloud native infrastructure is greatly facilitated by a service mesh, but succinctly summarizing and characterizing the performance of your service mesh in context of your unique workloads and your infrastructure of choice is a challenge unto its own.
We explore how to model your service mesh topology and optimize for your ideal configuration in context of how much you value properties of resiliency, performance, throughput, latency, and so on before you deploy to production. Readers will understand how distributed performance analysis offers unique insights on the behavior of microservices and their efficiency of operation, see examples of how common types of workloads perform under specific service mesh functions, and be empowered with analytical tooling that can be used to make optimized configurations.
We provide core, memory and I/O combinations based on workload needs with insights into workload analysis which can influence the efficiency of the service mesh and overall performance of the cluster.
Characterizing the Complexity of Combinatorial Analysis
Consider that the more value you try to derive from your service mesh, the more work that you will ask it to do. Said another way, that as someone reflects more deeply on the architecture of a service mesh - with its distributed proxies - and the functionality it offers, they will eventually wonder, "What overhead is running my service mesh incurring?". This is one of the most common questions engineers have as they initially learn of a service mesh and the value a deployment of one offers. This is not an easy question to answer as the permutations of configuration between your infrastructure, service mesh, and applications are innumerable and any change to one of them affects their collective performance.
How would you describe the performance of your service mesh and that of your clusters and their workloads? Are you imagining a wall of line charts with metrics capturing golden signals? The act of articulating the performance of your service mesh can take anywhere from a minute to even a few hours to characterize the state of your systems and the overhead incurred by your infrastructure and what this means to your users.
Moreover, anytime performance is characterized, analysis is subjective to the specific workload, infrastructure, and instruments used for measurement. Given the variety of this measurement challenge, most service meshes and their data plane proxies (if a third-party component), do not have the tooling necessary or refuse to publish performance data because such tests can be:
- arduous to create and sustain a capable harness
- a point-in-time consideration (none of the elements under measurement are static
- misinterpreted
Read on as we identify how to surmount each of these challenges.
Service Mesh Performance Considerations
As the software defined networking layer of microservices, service mesh encompasses multiple aspects of critical functions of the applications, such as circuit breaking, health checks, and packet operations. Analyzing the permutations of these configurations is an impossible task without a suitable test harness. A service mesh management plane can be such a tool. As the multi-mesh manager, Meshery is capable of provisioning 10 different service meshes, workloads atop the meshes, generating load using Nighthawk, and analyzing that load. No other tool capable of performing these tasks end-to-end exists. Meshery is a Cloud Native Computing Foundation project originally created by Layer5.
How are you measuring?
Consider the simple set of steps to execute performance tests in a simple Kubernetes-based cluster:
- Setup your cluster, service mesh, and application under test.
- Pick a benchmarking tool that can measure Layer 4 or Layer 7 performance.
- Configure your test setup for performance, doing so in context of other constraints that you might need to uphold (e.g. resiliency characteristics of your service deployment).
- Choose the protocol of interest: HTTP, HTTPS, HTTP1/2, gRPC, NATS
- Identify KPIs of interest - Transactions per second (TPS) or percentile latencies, etc.
- Decide on the test duration: 60s or 5 minutes or 1 hour...
- Choose the number of requests per second (RPS).
- Execute the test.
- Mark down requests per second, latencies, throughput, and any other output provided by benchmarking tools.
What are you measuring?
Performance of a service mesh can be described across multiple dimensions covering some or all of these core functionalities of a service mesh. So, which dimensions are the linchpins of performance? Which metrics are key indicators of performance? Outside of the different types of performance tests, performance management concerns include the need for performance and overhead data under a permutation of different workloads (applications) and different types and sizes of infrastructure resources.
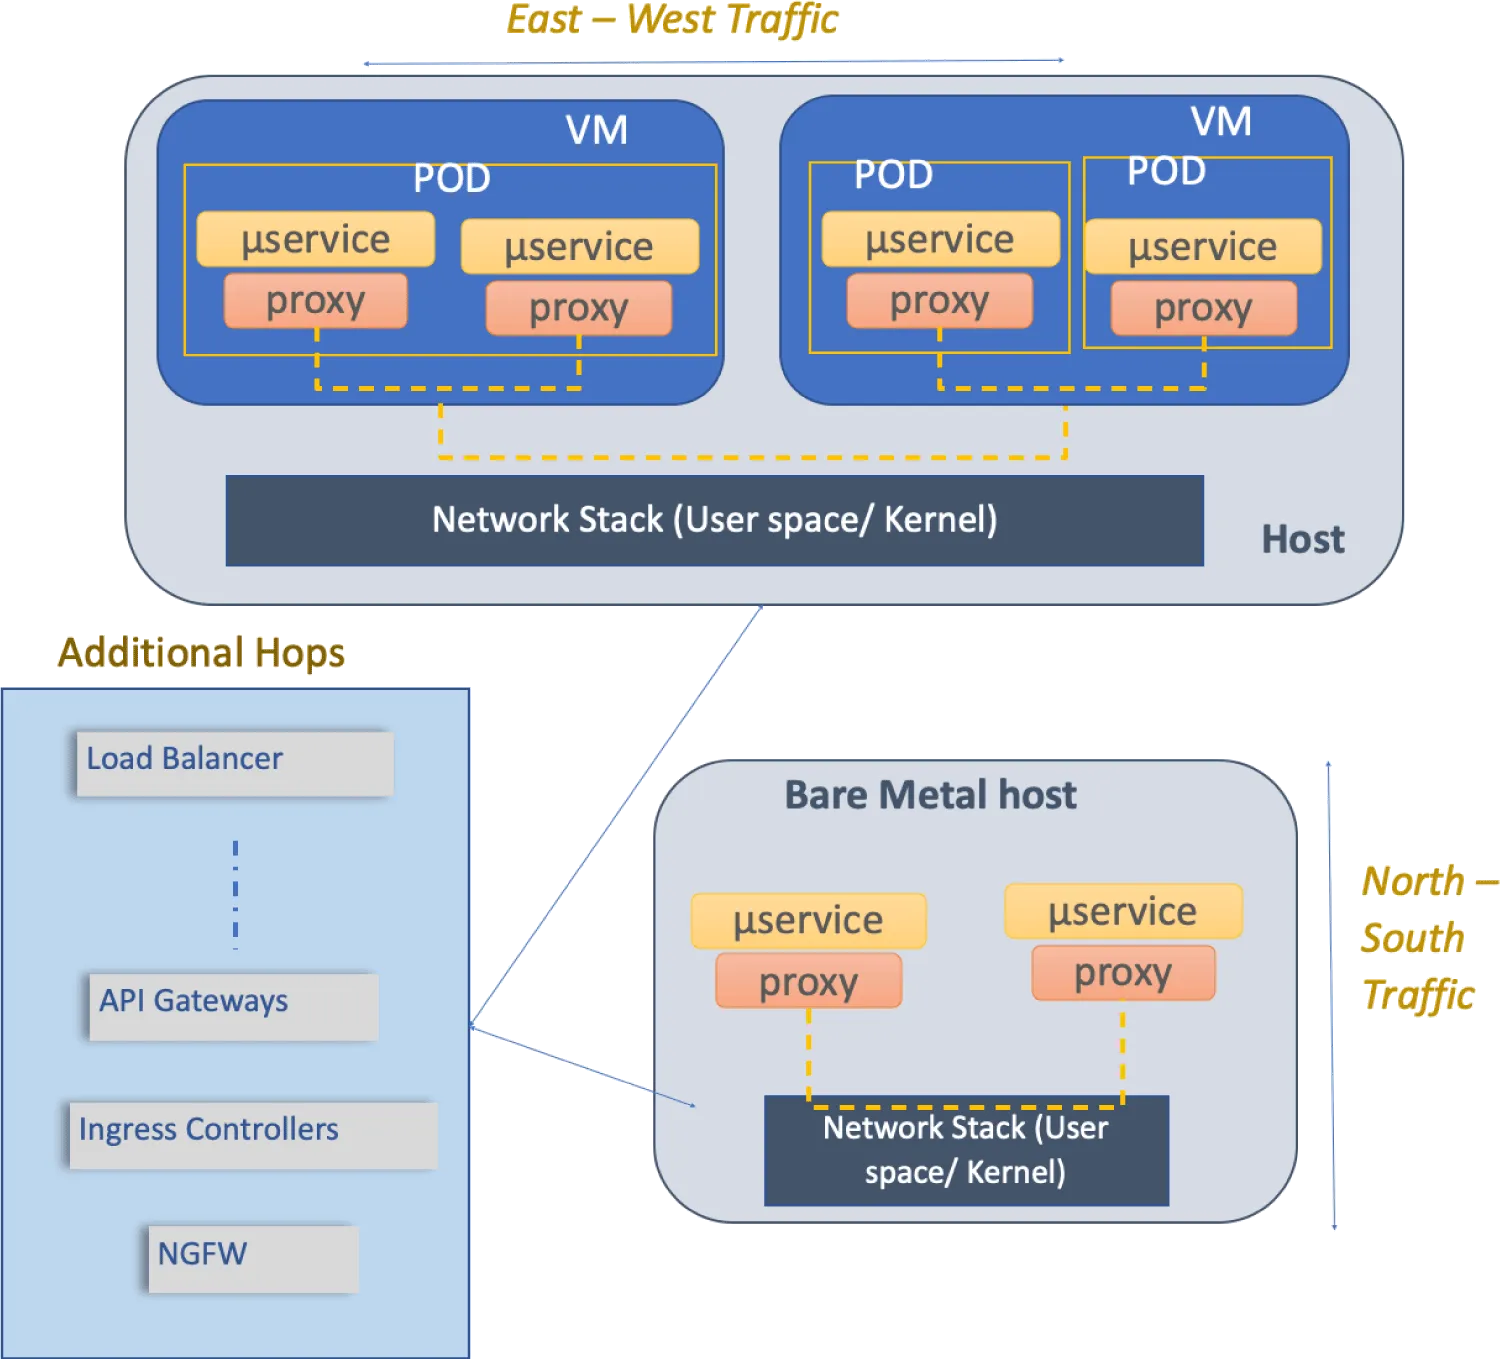
Hence, it is crucial to understand what is being measured in a service mesh based deployment. Certain critical considerations are missing from the simple methodology previously described. For example, as indicated in Figure 1, but not limited to:
- Traffic considerations
- East-West traffic
- between two pods within the same or two different Virtual Machines (VM).
- between two pods within the same or two different bare metal nodes.
- combination of above with choice of user-space or kernel-space networking stack on the host node.
- North-South traffic
- Throughput and latency of traffic flowing in and out of a single VM or across a single bare metal node.
- East-West traffic
- Deployment considerations
- Number of hops between traffic source and traffic destination with load balancers, API gateways, ingress controllers, security components such as firewall, deep packet inspectors, and so on.
- Operating system settings.
- Hardware settings such as BIOS options, power management features, NUMA awareness, platform resource management, hardware accelerators, and so on.
- Load generators types
- hardware or software based, L2-3, L4-7, open or closed loop
- Service mesh types - the service mesh landscape has over 20 meshes listed. Each share a common architecture, however, their implementation differs and consequently, so does their performance.
- Control plane - often a point of contention the larger the service mesh deployment is.
- Data plane - not only proxies, but filters loaded in those proxies.
- Service mesh configuration and number of services on the mesh. To name a few considerations:
- Telemetry
- Including the three pillars of observability are traces, logs, and metrics.
- The number of, cardinality of, sampling rate, ingest rate… all bear weight (and bear load on the system).
- Policy
- Authentication, Authorization - frequency of checks, cache hits vs. cache misses.
- Security
- Encryption - overhead of handshaking and mutually authenticated TLS.
- Telemetry
Ultimately, the goal of any performance tests is to ensure repeatable measurements and obtain consistent results across multiple test runs.
Service Mesh Performance as a Specification
The need for cross-project, apple-to-apple comparisons are also desired in order to facilitate a comparison of behavioral differences between service meshes and which one might be best-suited for specific workloads. Individual service mesh projects shy from publishing test results of other, competing service mesh projects. The need for an independent, unbiased, credible, standard measurement is one of the catalysts for the creation of Service Mesh Performance (SMP).
Amidst performance concerns and the need to measure and manage performance arose the Service Mesh Performance (SMP) standard. Service Mesh Performance as a specification and disseminating insights and research results. Your authors are working toward the definition of MeshMark, a universal performance index to gauge your mesh’s efficiency against deployments in other organizations’ environments.
Many performance benchmarks are limited to single instance load generation (single pod load generator). This limits the amount of traffic that can be generated to the output of the single machine that the benchmark tool runs on in or out of a cluster. Overcoming this limitation would allow for more flexible and robust testing. Distributed load testing in parallel poses a challenge when merging results without losing the precision we need to gain insight into the high tail percentiles. Distributed load testing offers insight into system behaviours that arguably more accurately represent real-world behaviours of services under load as that load comes from any number of sources.
The specification itself provides a standard format for describing and capturing:
- performance test configuration
- Pick a benchmarking tool that can measure Layer 4 or Layer 7 performance.
- service mesh configuration
- environment configuration
- workload configuration
- performance test results
- Distributed performance modeling
- KPIs for service mesh performance
- Test tool requirements
Value from a service mesh is best derived when it's tuned to scale as per the deployment requirements. Given the complexity of deploying, testing and measuring performance aspects across multiple dimensions, the specification aims to provide a simple starting point for anyone looking to understand and derive service mesh performance. The service mesh performance standard aims to articulate these complexities in a methodical and automated manner in order for anyone to plan the performance scenarios of their deployment and execute relevant tests.
The code snippet provides insight on the fact that the specification defines a common collection of statistical analysis to be calculated for every performance test.
1message PerformanceTestResult {2 message Latency {3 double min = 1;4 double average = 2;5 double p50 = 3;6 double p90 = 4;7 double p99 = 5;8 double max = 6;9 }10}
Snippet of the Service Mesh Performance specification describing how to capture statistical analysis of test results.
Defining Deployments
Virtualized deployments involve deploying microservice orchestration and service mesh stack in virtual machines (VMs). Although bare metal usage has performance benefits, customers often use VMs to provide hardware-level isolation between various applications. This deployment involves two VMs across two nodes, with one acting as a Kubernetes master with the other a worker node. Customers deploy VMs on a single NUMA node to avoid cross UPI traffic. Results in virtualized testing have shown that depending on pinning of QEMU threads to a set of isolated cores - either sequentially or clustering the threads together to all the cores - tail latencies are heavily impacted.
Microservice deployments could use a wide variety of deployment scenarios. The following list provides a sample set of how a service mesh performance could be analyzed either on a same node or in a multi-node cluster:
- Pod to pod communication.
- Pod to service communication.
- Ingress controller to pod and vice-versa.
- Load balancer to pod and vice-versa.
- Pod to Egress Gateway.
- Mutual TLS termination across any of the above endpoints.
- Different security rules and policies.
- Communication protocol.
These considerations are illustrated in a typical workload deployment as shown in Figure 3.
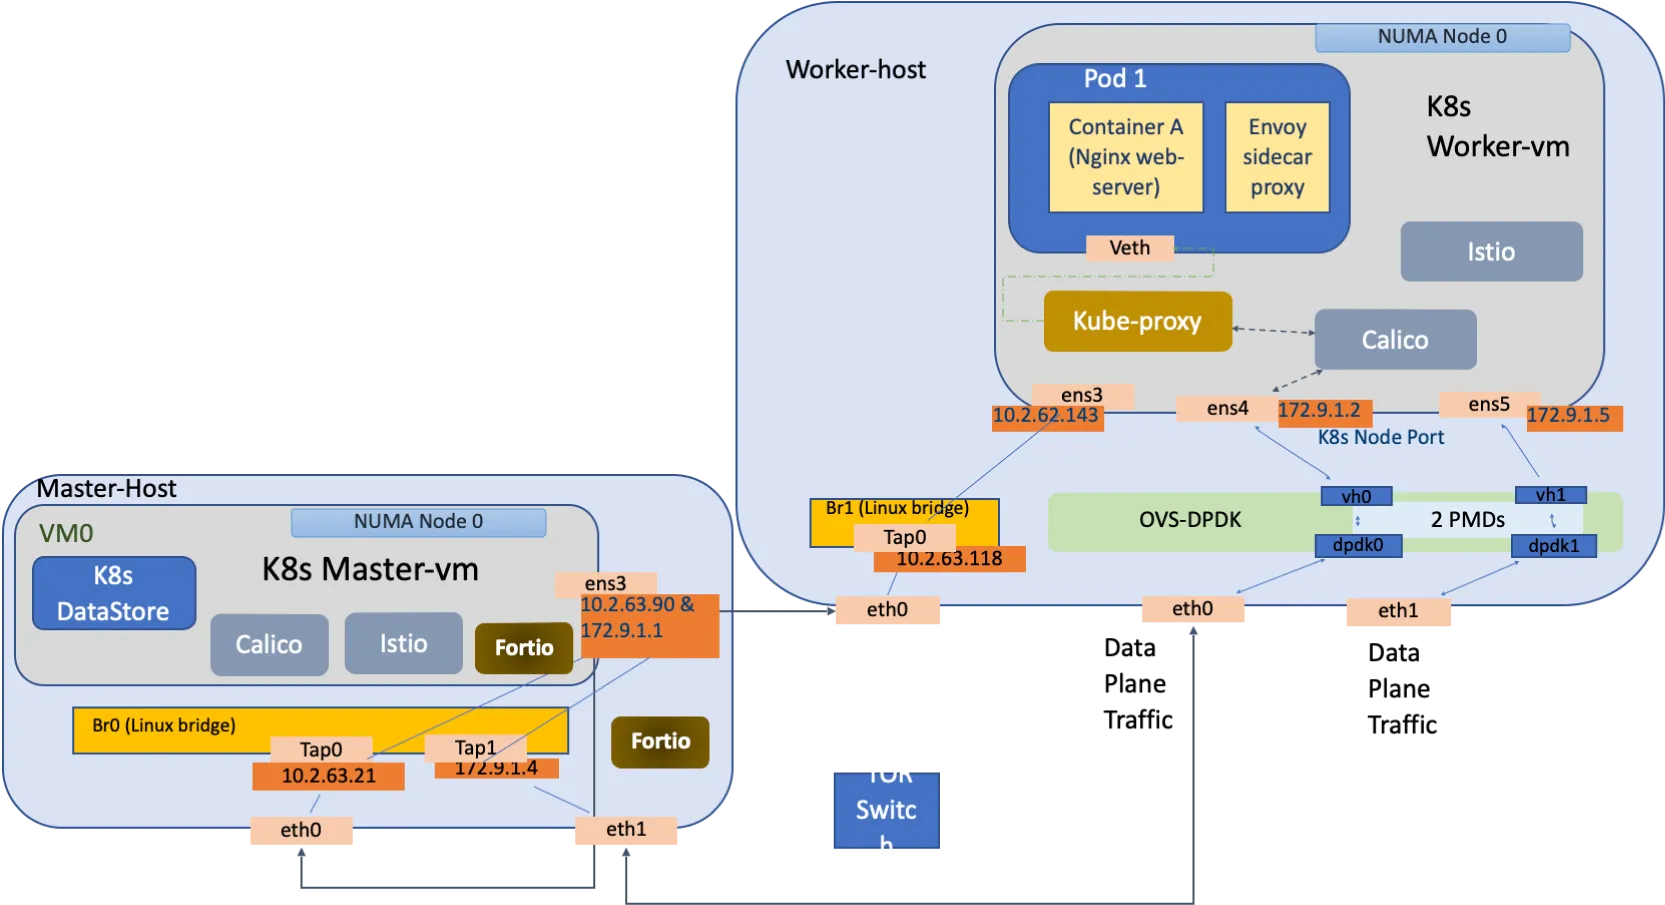
Here is an example of deployment with Kubernetes as the orchestrator using Calico CNI and deployed in VMs, while the host infrastructure has OVS-DPDK for switching, which can be extended for VMs to leverage SR-IOV. To understand impact of infrastructure elements and networking elements of microservice software stack, performance impact of a service mesh and its set of data plane proxies with fortio as load generator could be understood by running the Meshery in two different environments outside the Kubernetes cluster.
- First one with load generator running as a process outside of Kubernetes cluster in master-vm
- Second one with load generator running as a bare metal process on master-host
Automating Performance Measurements
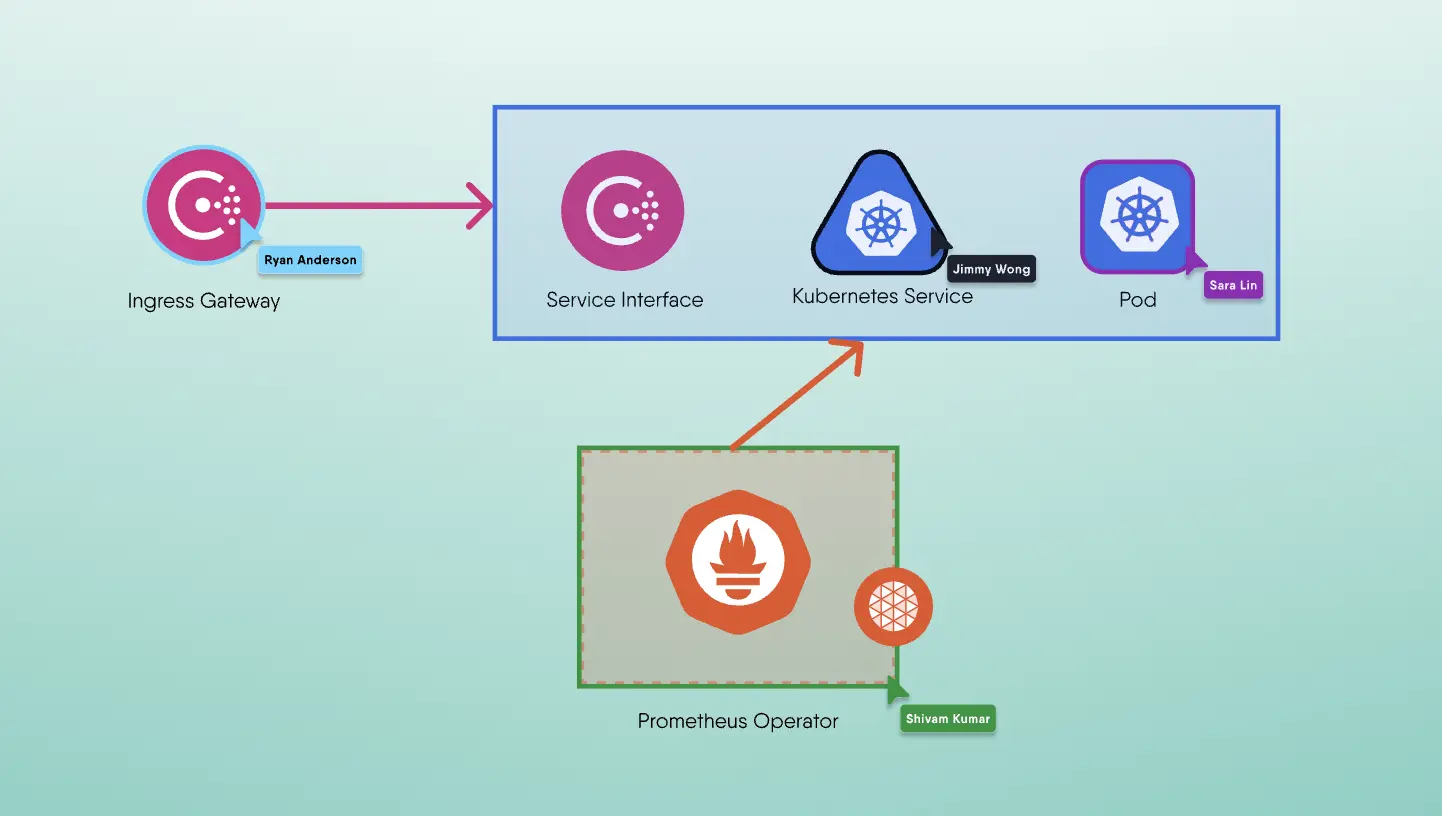
Meshery is ideal tooling in that it provides lifecycle management of a large number of service meshes and sample applications which need to be provisioned, configured, and deprovisioned in the process of analyzing service mesh performance. Meshery is capable of generating load, baselining, and comparing performance results. The canonical implementation of this specification is implemented in Meshery.
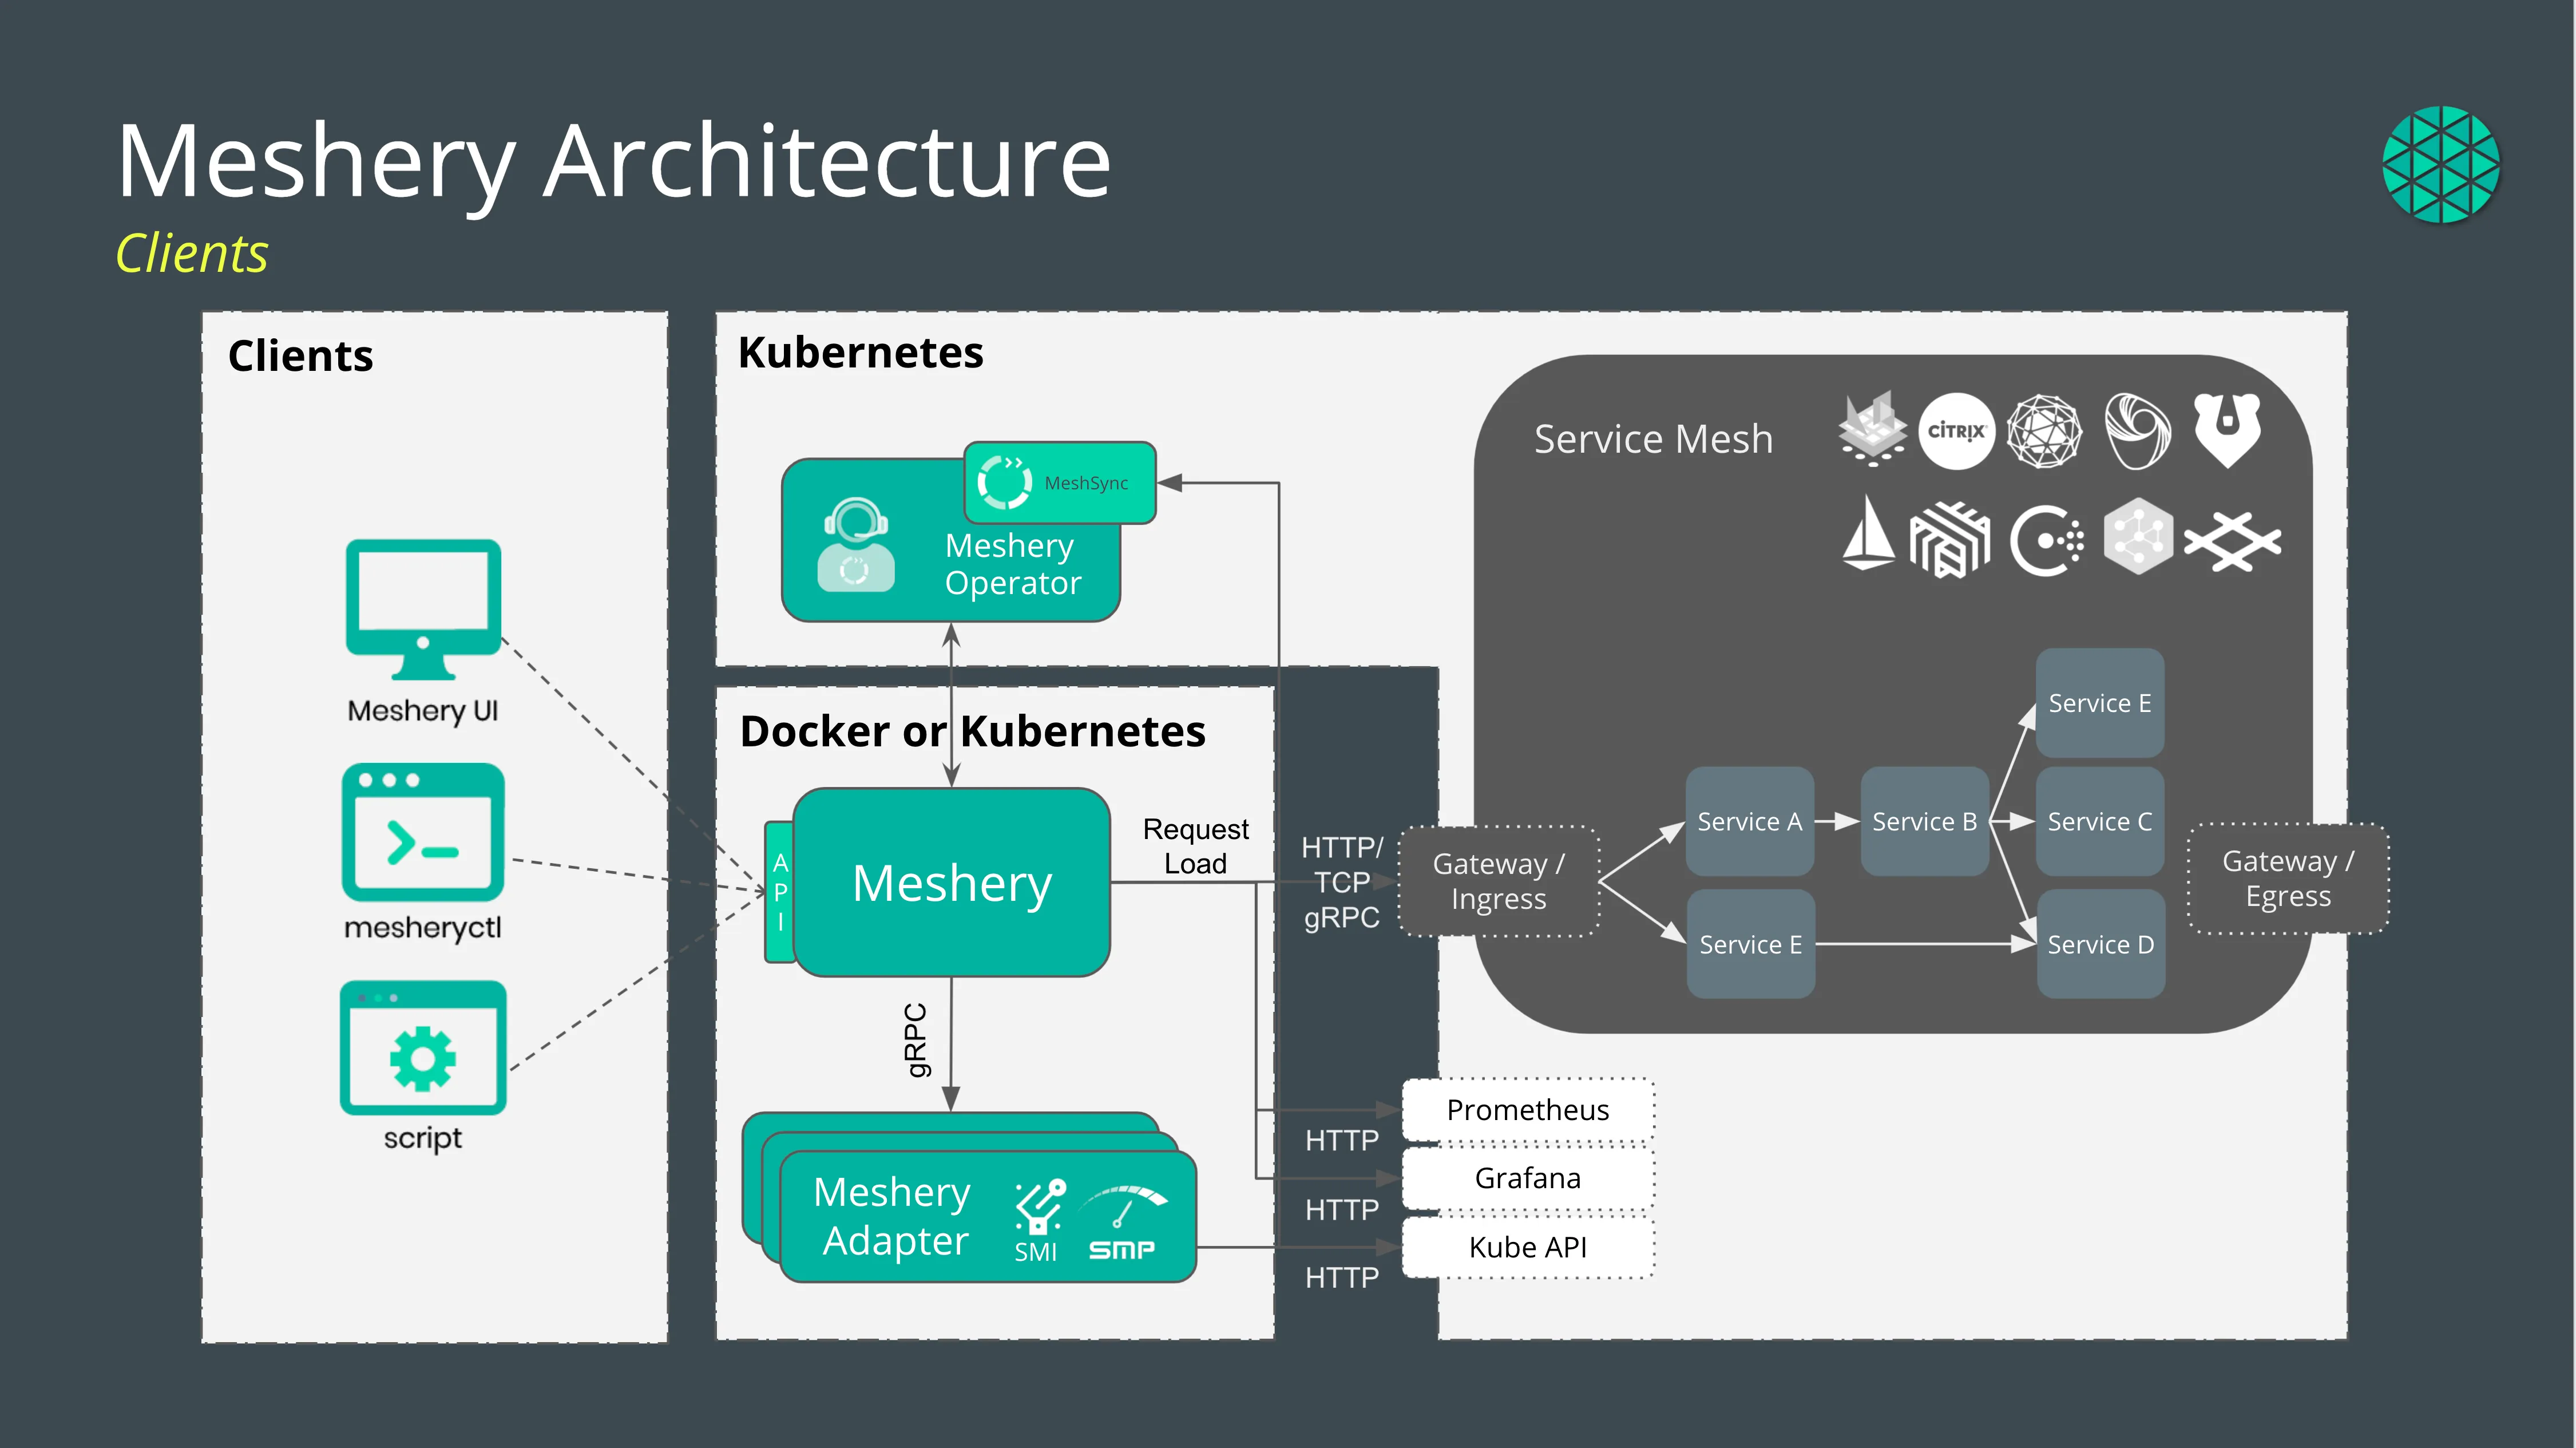
Figure 4 - Meshery’s load generators can be deployed in the same cluster under test or outside of the cluster under test.
Pipelining performance characterization
Acknowledging the living nature of user deployments, integration of automated performance testing into continuous integration systems helps users deploy new versions of their applications or new configurations of their infrastructure (including service mesh configuration) with the assurity afforded through the act of dry-running the service mesh and application configuration before production deployment. The Meshery and Service Mesh Performance GitHub Action offers the ability to adaptively analyze application performance as a gate in your continuous delivery pipeline. In this way, the Service Mesh Performance specification facilitates a measurement index that can be referenced when rolling out new versions of a service with this advanced canary technique.
Through Meshery, techniques to mirror non-idempotent requests without fear of impacting the current version of your application allowing replay of user requests. And use of intelligent network functions, embedded in WebAssembly (WASM) programs, to facilitate real user request reenactments to help you extract the most value out of your pipeline.
- Repeatability of test scenarios using performance profiles and cloud native orchestration.
- Baselining and comparing results.
Analyzing Performance Measurements
We have often seen inefficiencies in the ratio of resource usage vs resources applied. Since the mesh elements i.e. the ingress and sidecars share resources with one or more of the application containers, there may be more resources left to be utilized. Tail latencies decrease with the increase in number of cores for all 1, 10 and 100 clones but increase with the increase in the number of connections. Data for various connection counts, as shown, indicates that performance degradation with Istio shows up with input RPS more than 1000. In a top down microarchitectural analysis (TMA), when the front proxy is pinned to a single core and the sidecar + flask app is pinned to another core and the number of microservices are scaled up. It is observed that (Figure 2):
- Frontend Bound% decreases with increase in number of microservices and Core Bound % increases.
- Memory Bound % increases with increase in the number of microservices.
- L1 and L3 Bound% decreases for both the service cores on which the front –proxy is running as well as the core where the sidecar+flask app is running with number of microservices.
In customer environments, the size of the cluster as well as the amount of incoming traffic will have an impact on the number of workloads and Envoy microservices. The underlying hardware and L4 networking on each node in the cluster will also impact the performance observed. A call stack and cycles spent analysis of a deployment with 1-20 sidecars on a specific 40 core system with a 10G NIC shows bottlenecks spread between:
- Envoy:TheadLocalStorage-Hashset-Match
- Linux kernel bottleneck spread between
- Libpthreadscheduling
- Libevent
- Envoy buffer slice management and TCP filter, if message sizes or file transfer sizes increase to 1M
- Crypto operations when TLS is enabled.
Our initial studies show that the optimal service mesh setup for the tolerable latencies and the best RPS may include:
- Exclusive threads allocated to Envoy processing
- Reduced memory contention by allocating more memory bandwidth which can be controlled dynamically
- Load balancing of worker threads among the among cores which may require
- Less IO switching
- Optimized memory copies with signals incorporated in addition to events (libevent)
Accelerations and Offloads
A number of accelerations and offloads to SMART NIC or other processing elements like IPUs and DPUs are becoming available. How does the service mesh efficiency and performance benefitted from these deployment options needs to be defined and measured. Cycles and cores saved in the host cores vs offload cores which may be of different architectures and/or performance range needs to be quantified and benchmarks and indices created to measure.
Being Precise in Performance Studies
When measuring sub-millisecond response times, the noise floor of the environment as well as the sensitivity of the tooling may become dominant factors in measurements. Noisy neighbours, scheduler fairness, garbage collection, and even specifics in the timing of requests being sent as well as connection-reuse patterns may change noise floors such that similar measurements performed using different systems and tools may diverge an order of magnitude in absolute terms.
As a quick survey of load generators by way of those included in Meshery, we find upon close inspection their differences are noteworthy and justify their use under different circumstances.
Written in C, wrk2 supports ignoring coordinated omission. wrk2 lets you test a little more complex scenarios. Users express load generation profiles in terms of RPS. wrk2 shows you what you normally may not see in benchmark results, but what every 1,000th user might see. To see these outliers, you need to run the longer (time) performance tests. Wrk2 tests the scenario where there's a string of services comprising microservices. wrk2 requires you to specify the desired RPS, while wrk does not. Wrk2 is focused on driving the maximum RPS. Meshery’s fork of wrk2 enables testing of multiple endpoints and enables the variable rate of load generation. In the future, Meshery will offer the ability to assign a weight to each endpoint for the load to be generated by wrk2.
Written in Golang, fortio is extremely fast and usable for testing basic response times on a per request level. Fortio produces results in JSON on a per request basis and easy to integrate into other Golang-based tooling like Meshery.
Written in C++, Nighthawk supports both open- and closed- loop testing, and was designed to offer the right sensitivity for benchmarking microservice proxies (sub millisecond latencies). Using an open loop test methodology avoids coordinated omission, and in conjunction with its adaptive load controller one can seek answers to questions like “what RPS can my mesh reliably sustain under set latency?”.
Comparing Types of Data Plane Filtering
Important to note is the power of the service mesh data plane and cost of that power. Envoy is a popular proxy of choice for service mesh data planes. Among other features, Envoy provides the ability to integrate custom traffic filters via one of two methods:
- Natively by incorporating your custom traffic filter into Envoy’s C++ source code and compiling a new Envoy version. The drawback being that you need to maintain your own version of Envoy, while the benefit being that of your custom filter running at native speed.
- Via WASM by incorporating your custom filter as a WebAssembly binary writing in C++, Rust, AssemblyScript or Go. The drawback being that WASM-based filters incur some overhead, while the benefit being that you can dynamically load and reload WASM-based filters in Envoy at runtime.
Whether to integrate your traffic filters natively or as an extension, a tradeoff between the two deployment exists primarily in exchanging between service mesh speed and service mesh flexibility as shown in Figure 4.
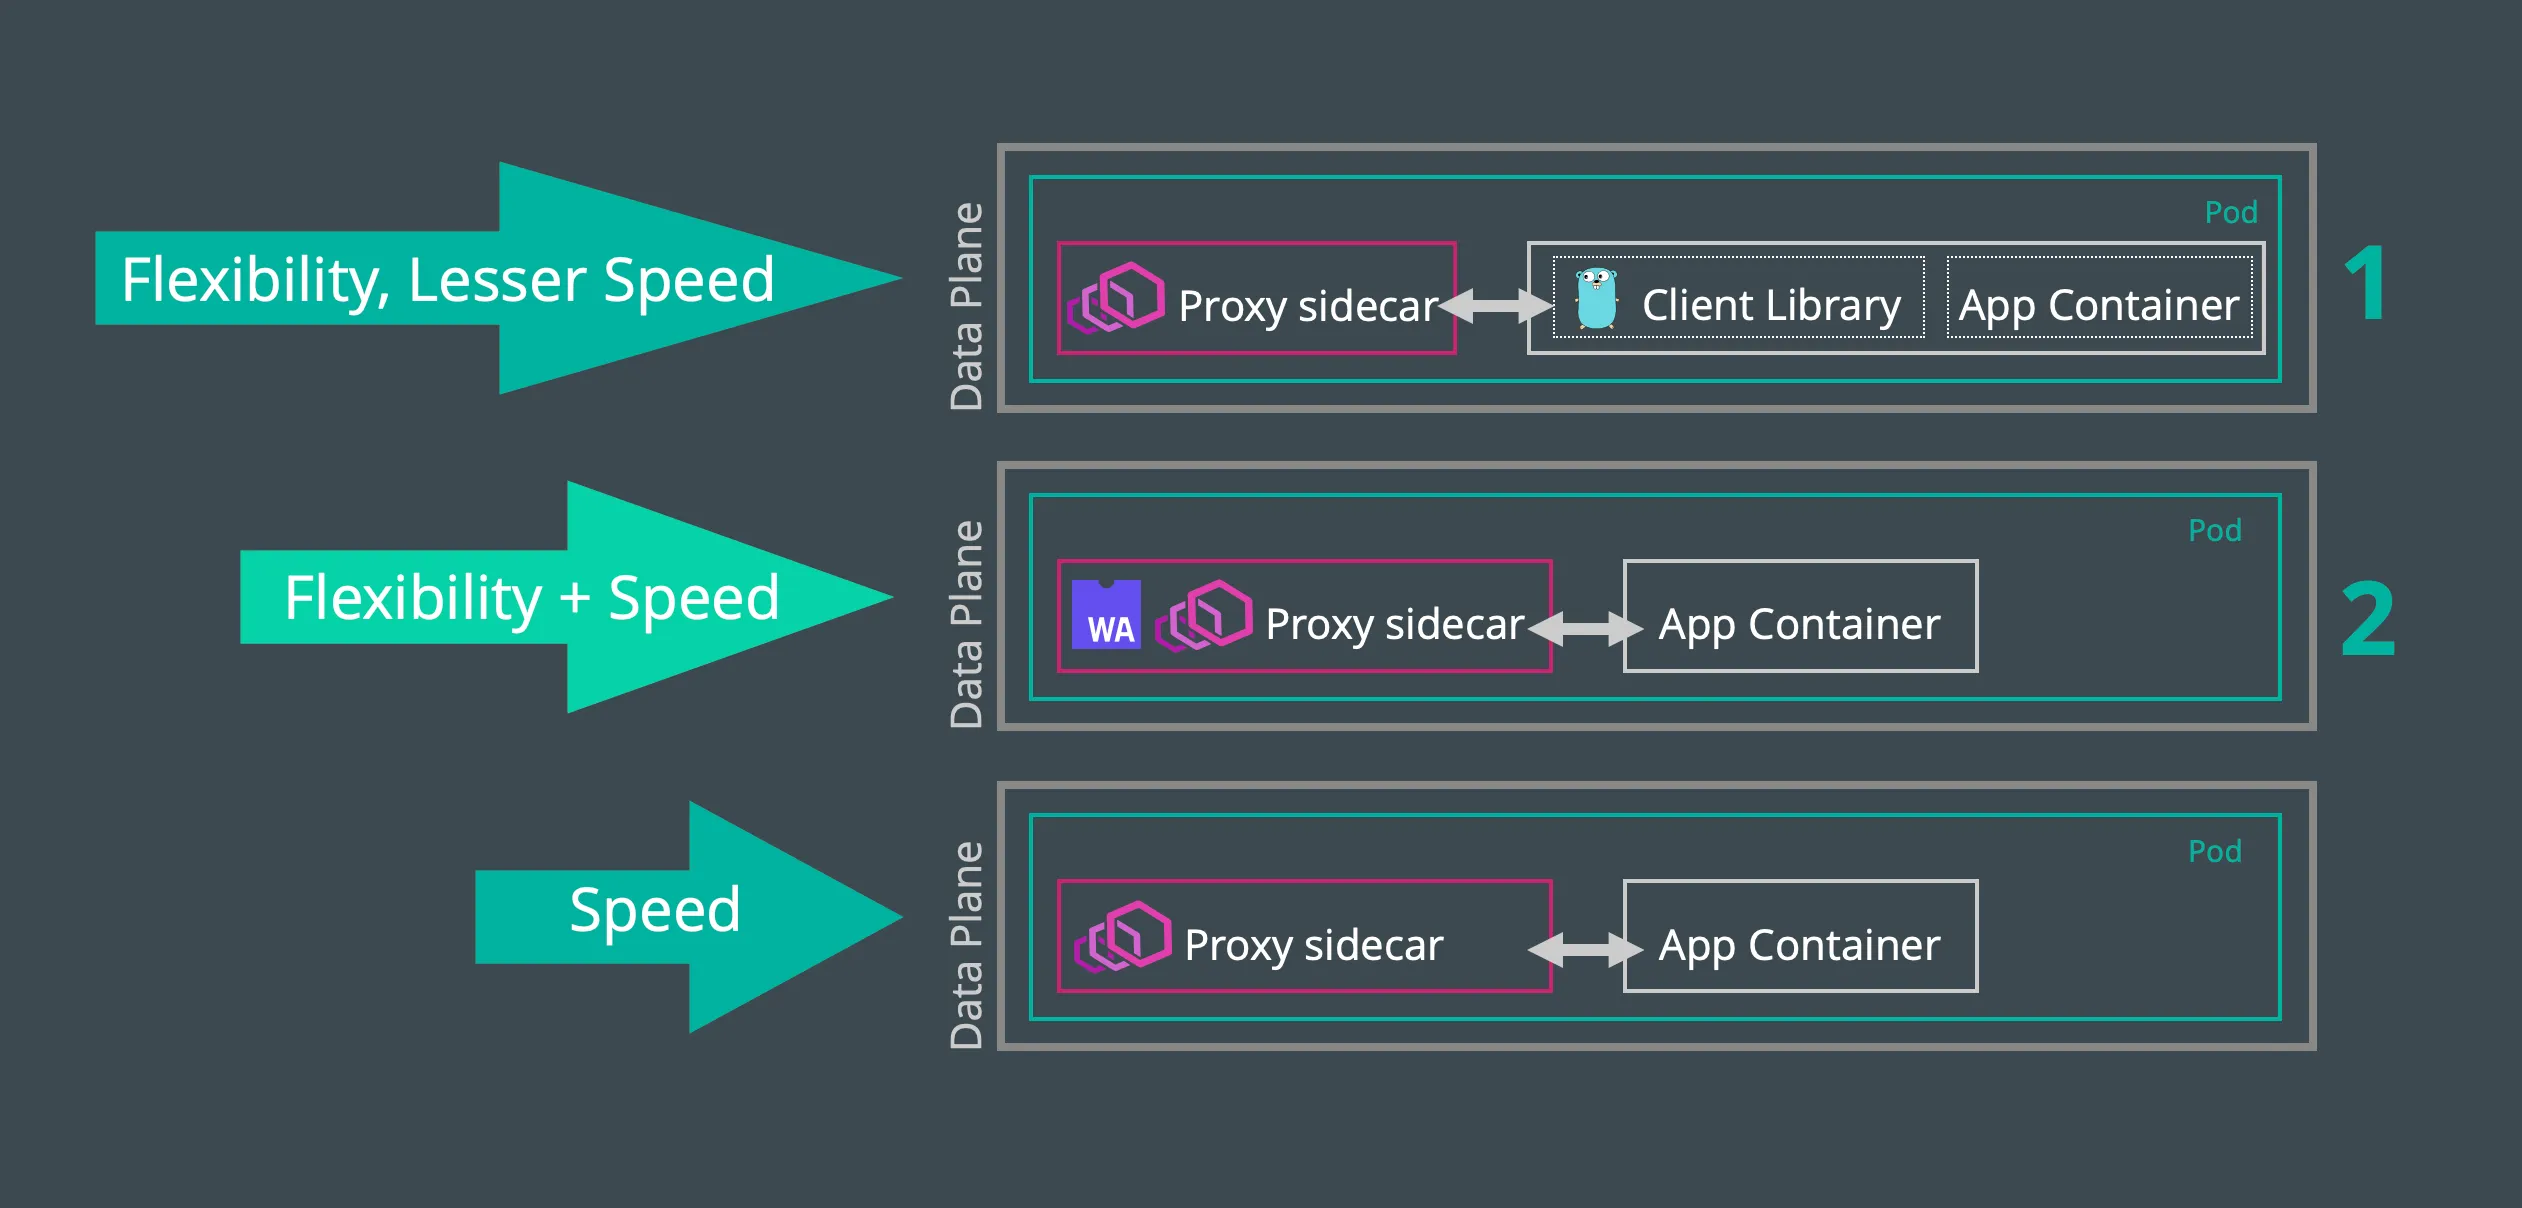
Figure 5 - A comparison of different modes of delivery of service mesh network functions.
As an assessment of this tradeoff, an analysis of a series of three tests run across the same rate limit network function implemented as 1) a Golang-based client library, or 2) a Rust-based Envoy filter running in a WebAssembly virtual machine (or 3) a native Envoy filter) provides some insight as to the comparative overhead involved.
- Rate limiting with Go client library
- At 100 RPS the p50 is 3.19ms.
- At 500 RPS the p50 is 2.44ms.
- With unlimited RPS (4,417) the p50 is 0.066ms.
- Rate limiting with WASM module (Rust filter)
- At 100 RPS the p50 is 2.1ms
- At 500 RPS the p50 is 2.22ms
- With unlimited RPS (5,781) the p50 is 0.62ms
Users not only need to account for the (relatively) easy to quantify system overhead and the operational overhead involved in expanding development resources to implement bespoke tooling versus managing off-the-shelf filters.
Summary
To deploy a service mesh effectively, we need to
- quantify application workload characteristics and how it utilizes a particular microarchitecture.
- assess how Container Network Interface (CNI) drivers, Open Virtual Switch (OVS), rules processing, match and lookup requirements between Network Address Translated (NAT) and routed networks are required
- different layers of service mesh to be deployed including layer 4 load balancers, ingress and reverse proxy, number of sidecars and number of microservices to be supported
- and what hardware baseline performance does the setup have and
- a quantifiable measure of service mesh deployed with performance measures mapped to KPIs like throughput (RPS) and latency.