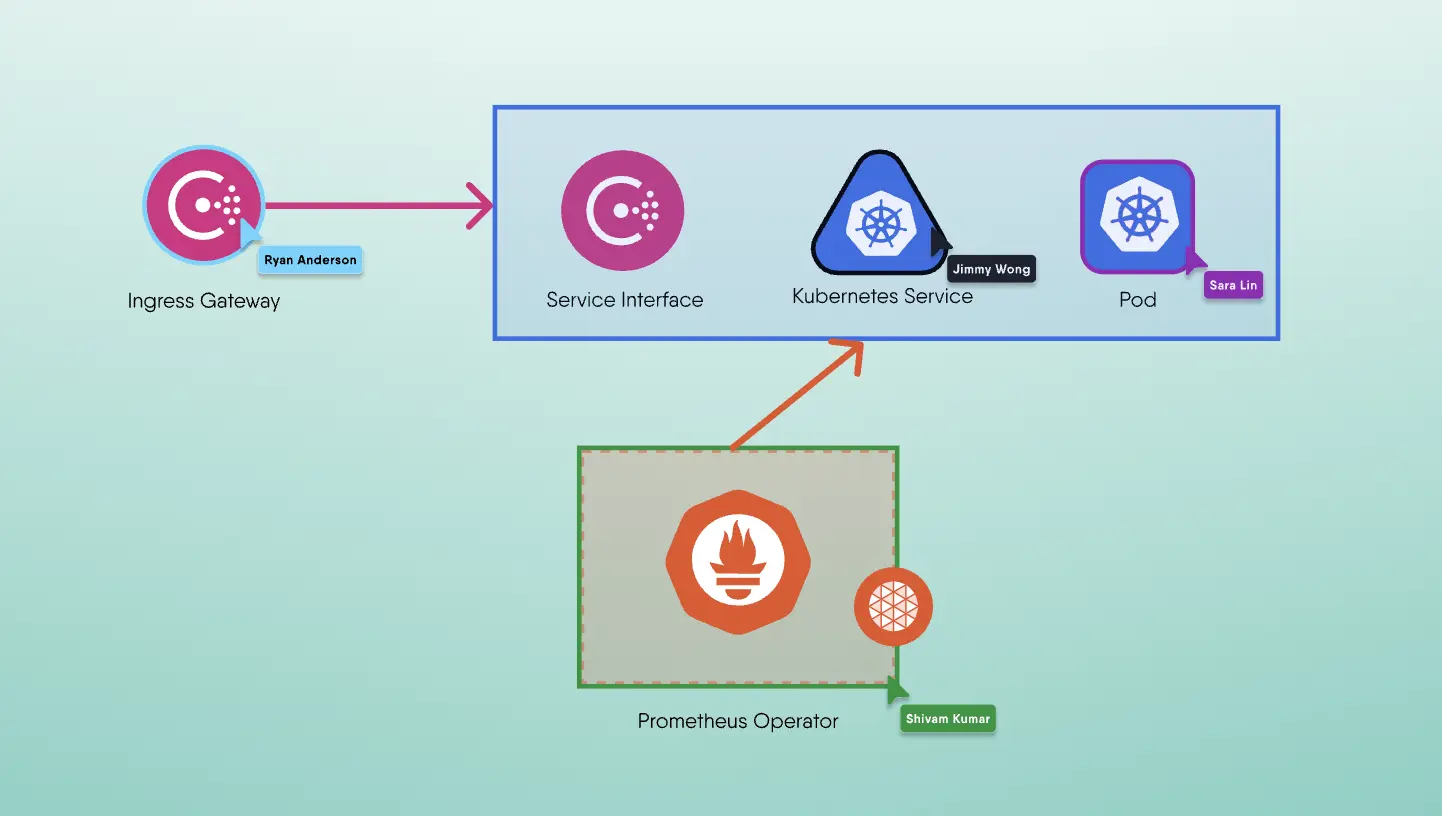
Lee Calcote and Mrittika Ganguli presented MeshMark: Service Mesh value measurement at ServiceMeshCon Europe 2022.
Lee Calcote is an innovative product and technology leader, passionate about empowering engineers and enabling organizations. As the founder and CEO of Layer5, he is at the forefront of the cloud native movement. Mrittika Ganguli is the Director Cloud Native Data Plane, Principle Engineer and Network Architect at Intel.
What is Meshmark?
MeshMark is a performance index that measures the value and overhead of your cloud native environment. By converting performance measurements into insights about the value of individual, cloud native application networking functions, MeshMark distills a variety of overhead signals and key performance indicators into a simple index.
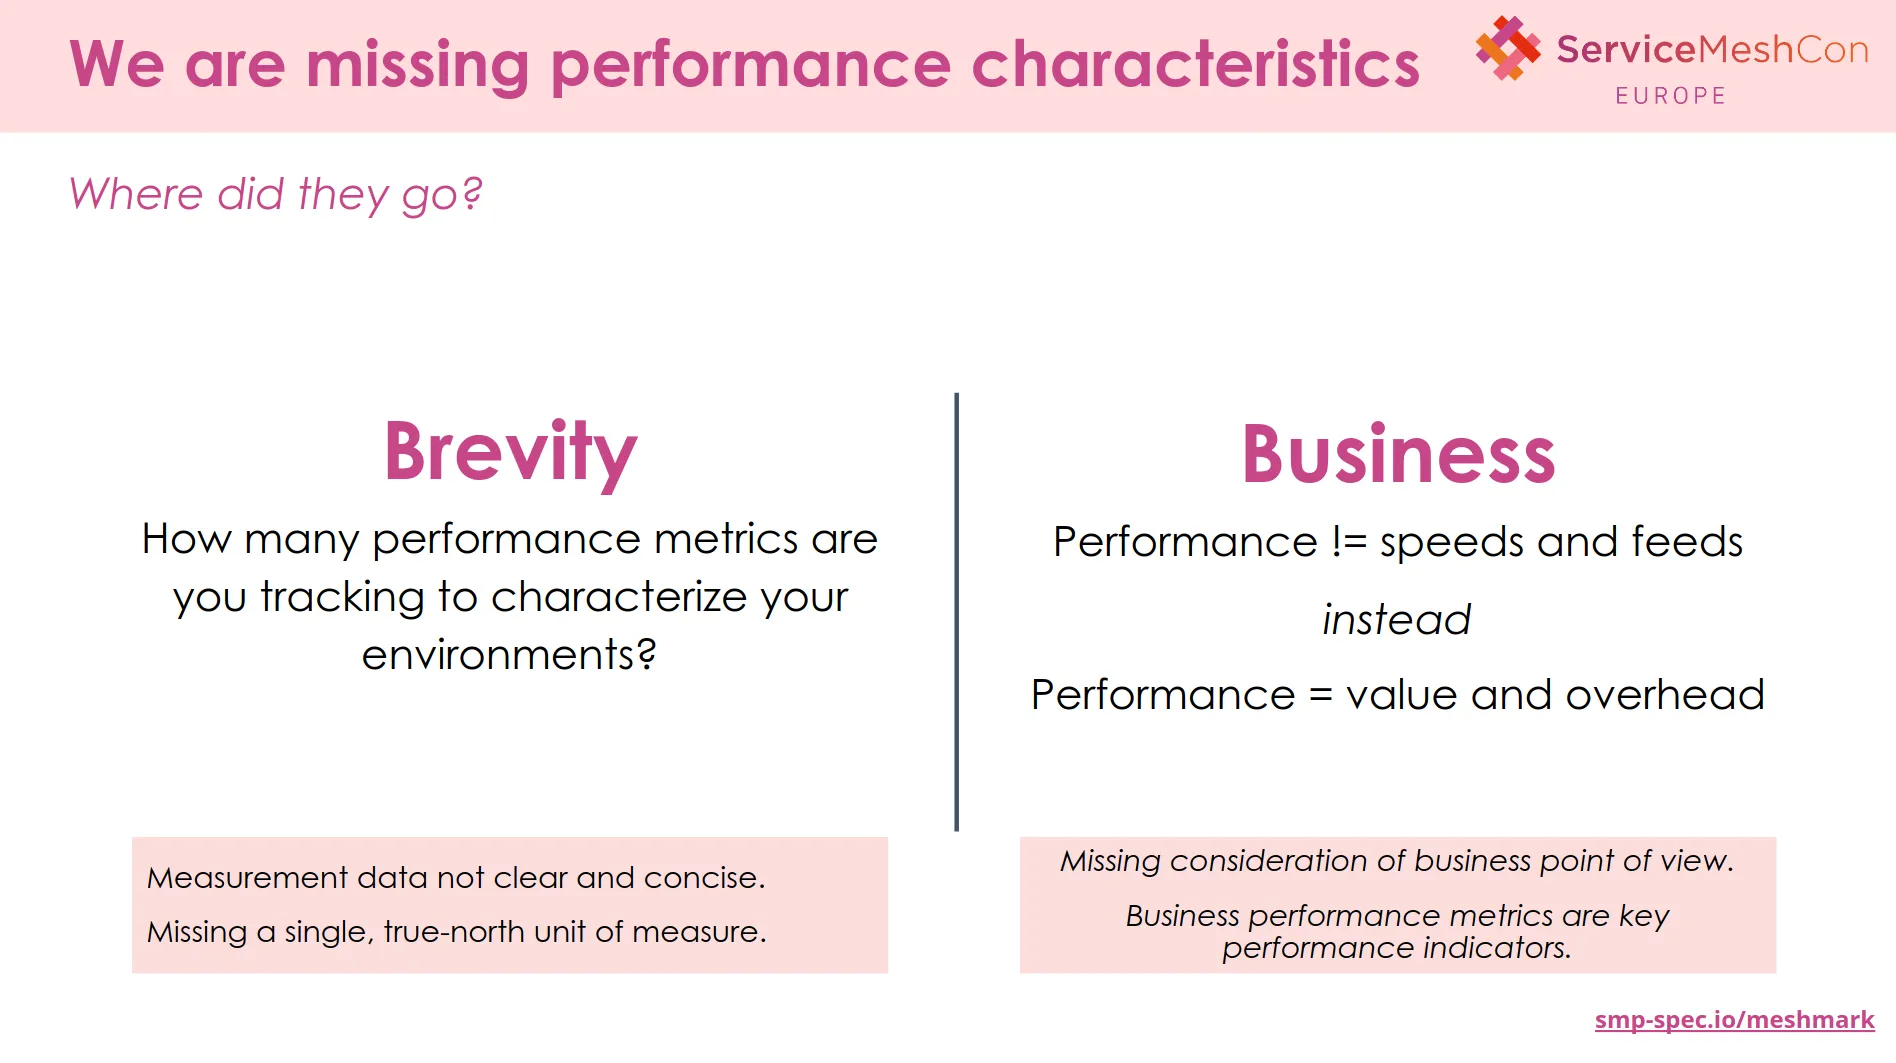
Talk started with a question to audience: Missing performance characteristics?
We are missing some performance characteristics, as people has many metrics used to track environments it might take a while to articulate the characteristics performance of your environment.
Lee Calcote
Lee Calcote explains about "Business Performance"
We're quite frequently overlooking business performance, which is in large respect to why we're running the infrastructure in the first place. We usually talk about performance and cold, hard, quantitative speeds and feeds, but instead, I would submit to you that performance should absolutely be measured in terms of speeds and feeds, but it's a lot more meaningful to layer in the value and to quantify the value that your infrastructure is providing. So we're really kind of missing the business performance aspects of what we're tracking, how we're characterizing.
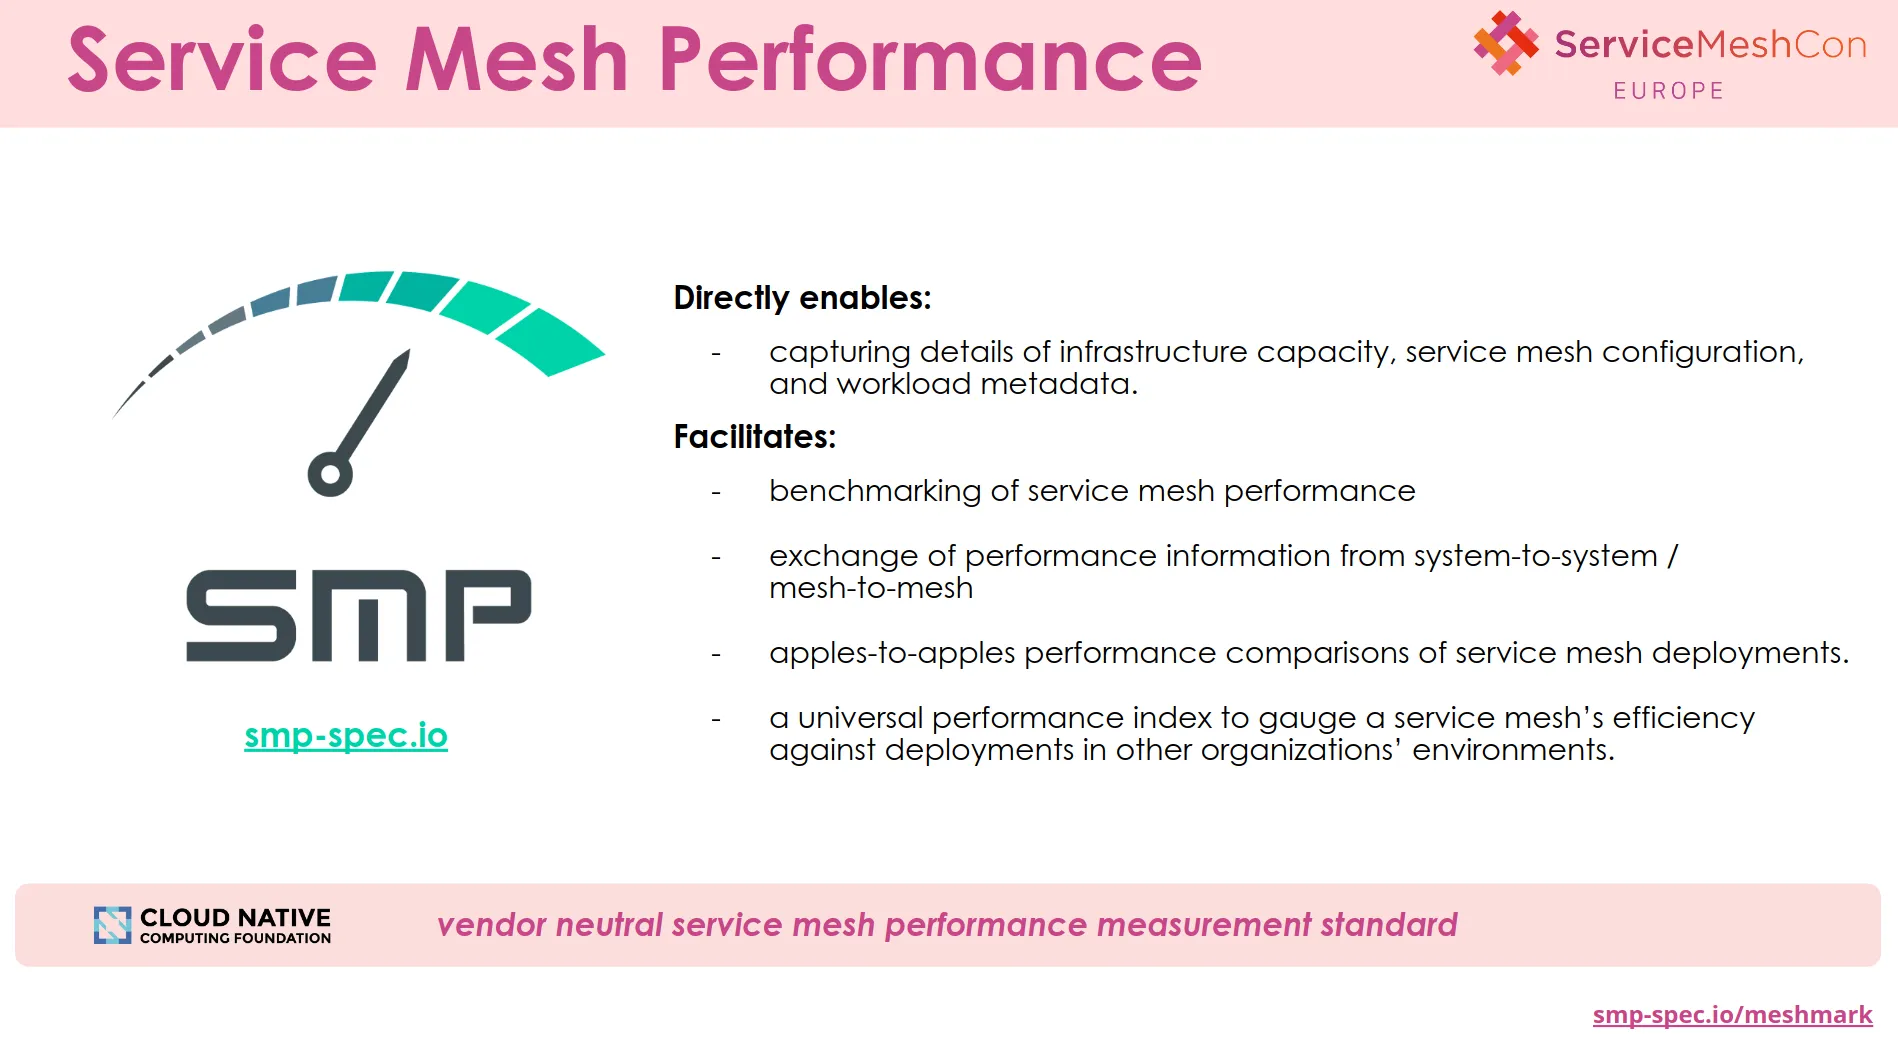
Introduction to Service Mesh Performance
The Service Mesh Performance project falls under the umbrella of CNCF project. This project is, at its core, probably a specification for capturing the details of your environment in a uniform way, in a consistent way, capturing your infrastructure configuration, your service mesh configuration, and characterizing the details of your workloads and doing so consistently such that you can baseline your environments. You can benchmark them in a consistent way, share with others, maybe compare with the performance that others are having. To the extent that it's codified, you can have system to system exchange of this information.
Mrittika Ganguli introduces MeshMark with an example
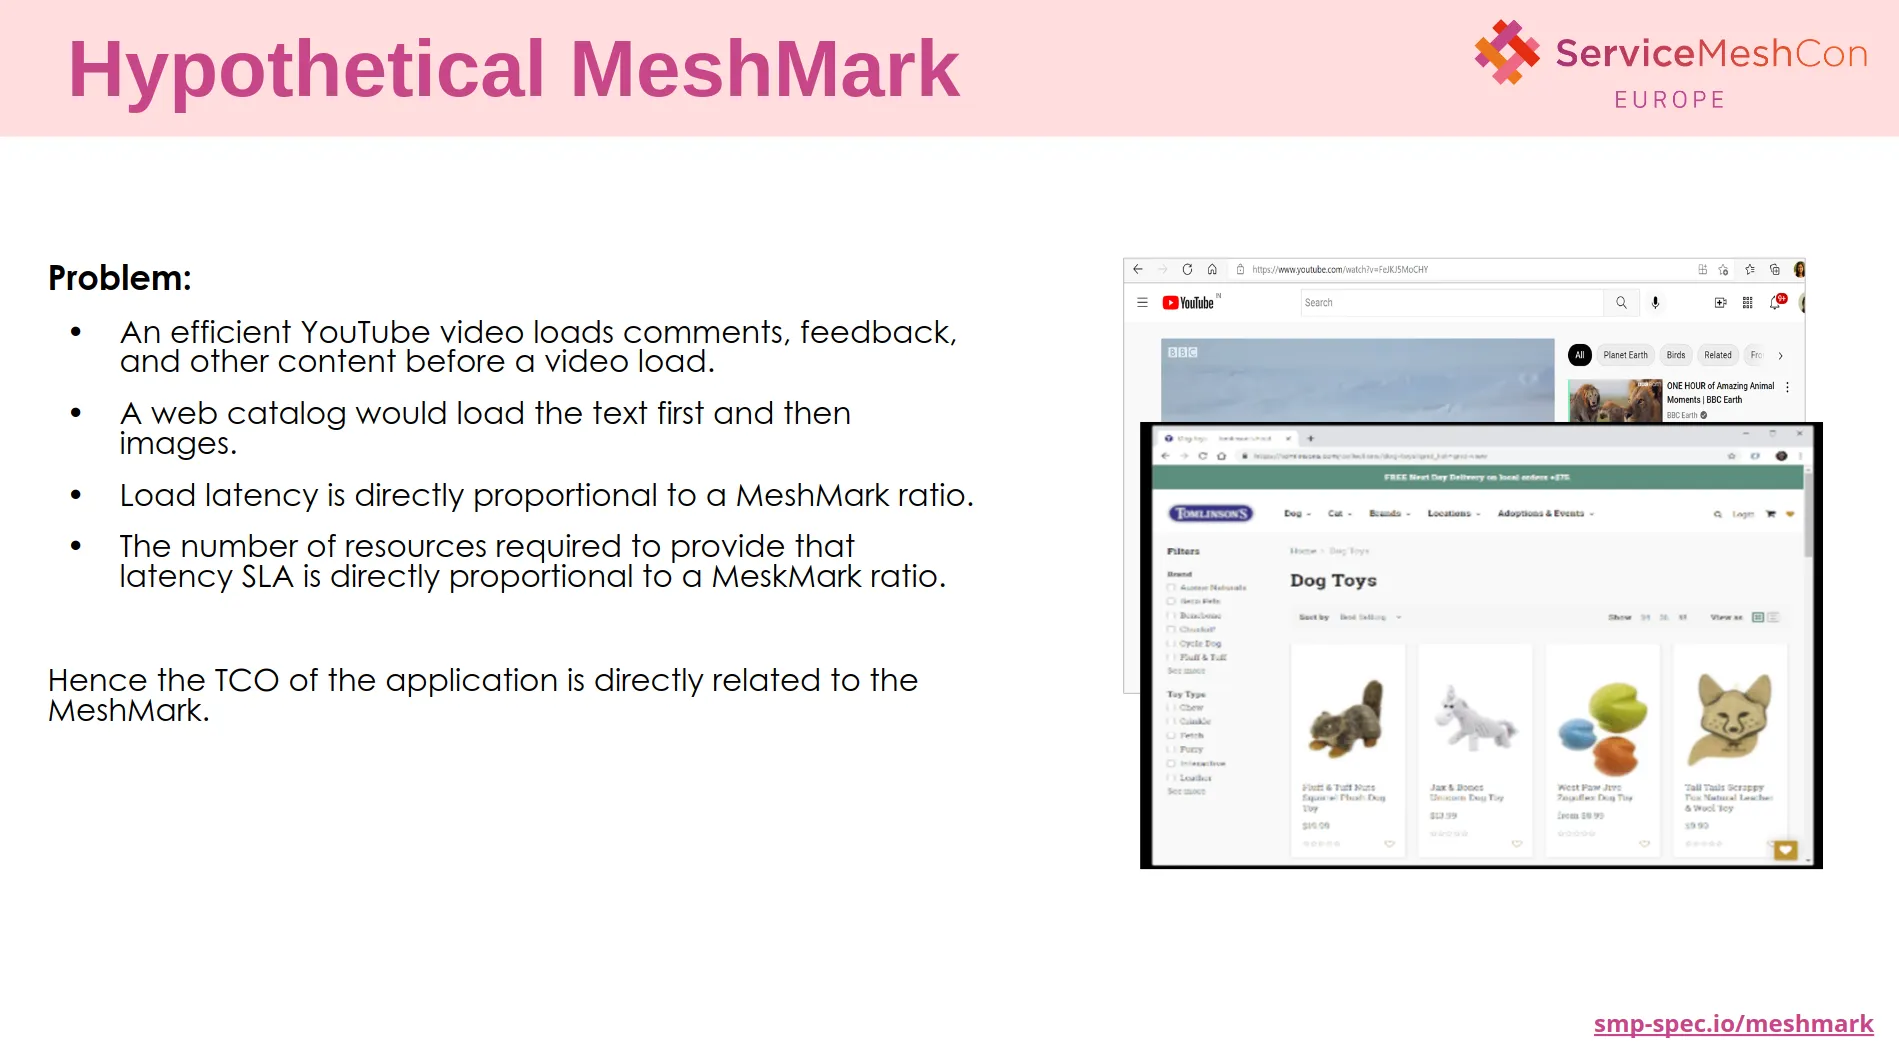
MeshMark is a Cloud Native value measurement, from value you are essentially trying to measure if the performance of your infrastructure matches what you want to get from your deployment, what kind of value you want to get, business value you want to get from your deployment. So, for example, if you have some key performance indicators, do you want to measure whether the MeshMark value is directly responsible for how your video gets loaded or your image gets loaded on a particular webpage.
Are my resources utilized as best as possible? Why am I not getting the SLO met with 4 resources when I only needed 1 resource without the service mesh? How can I improve my 99.9% latencies or can I map my service policy to utilization? Is the network a performance hog, or storage, or cache? Meshmark intends to help model and provide an index for many of these areas
Mrittika Ganguli
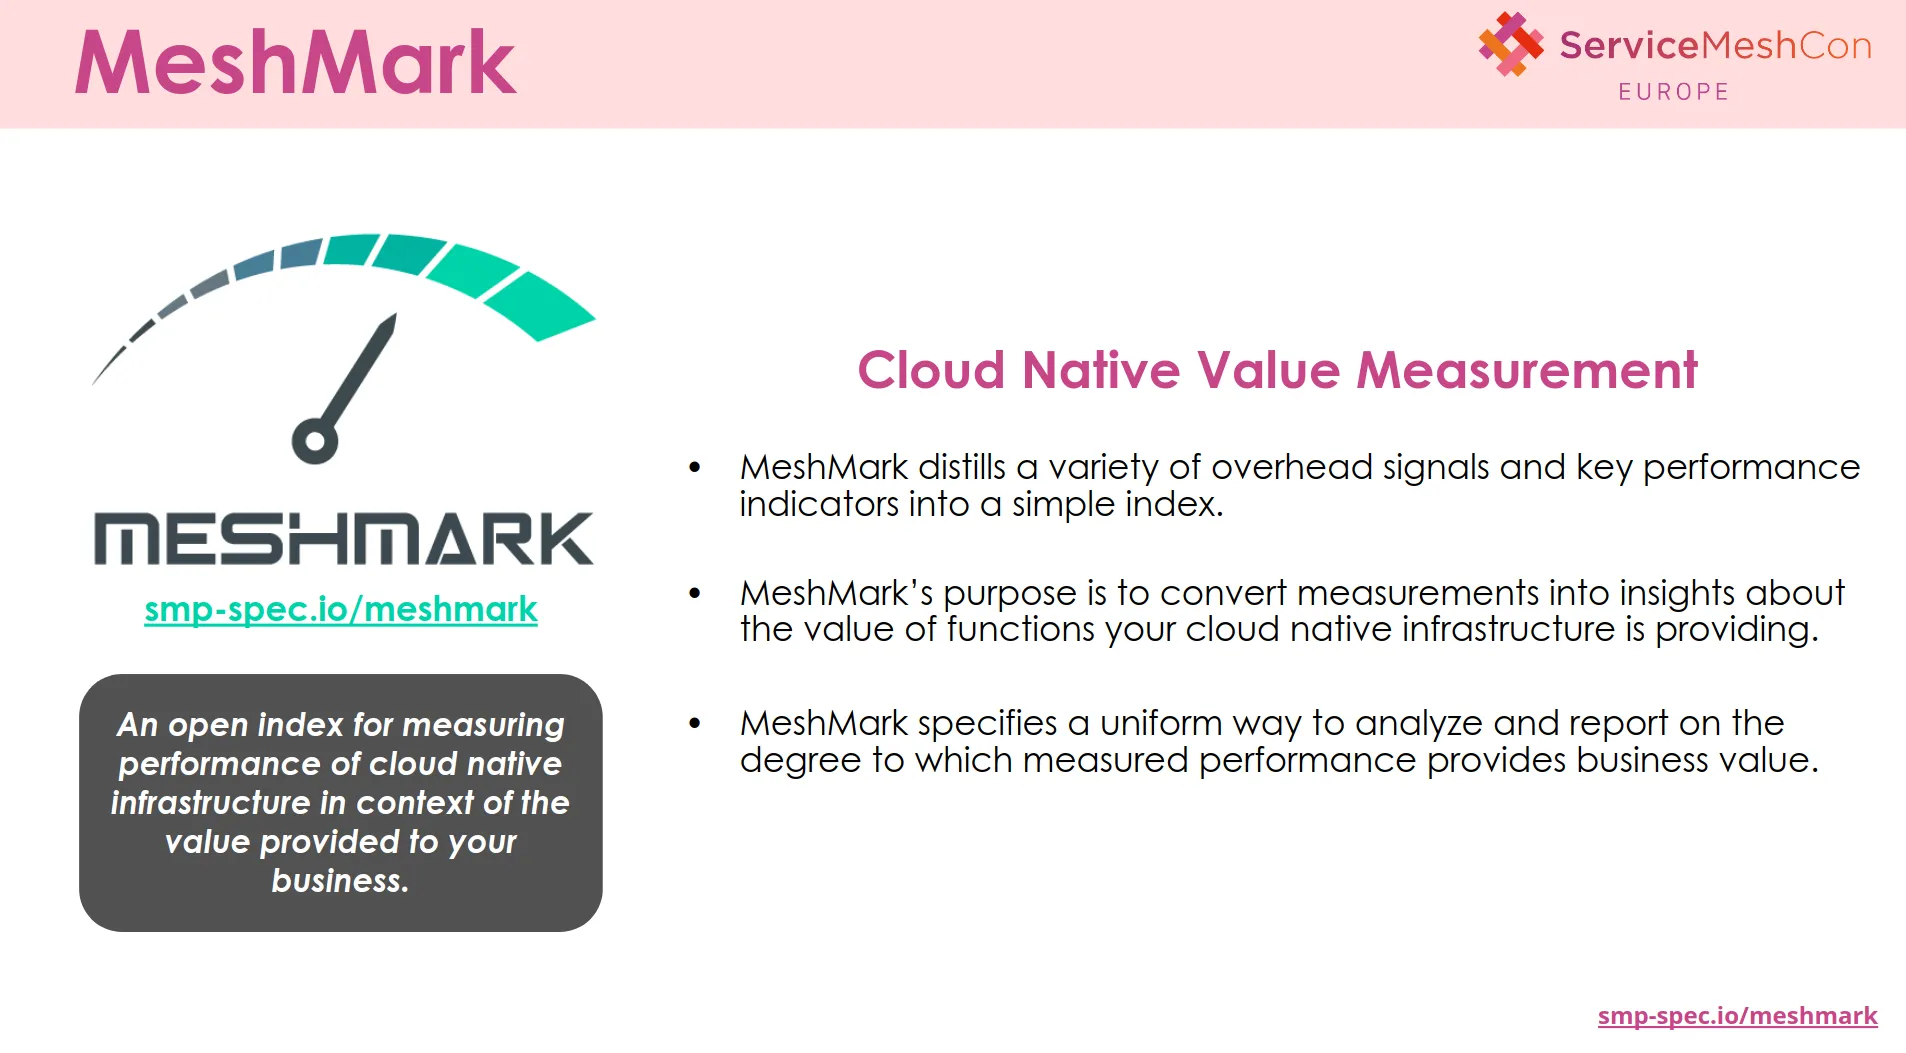
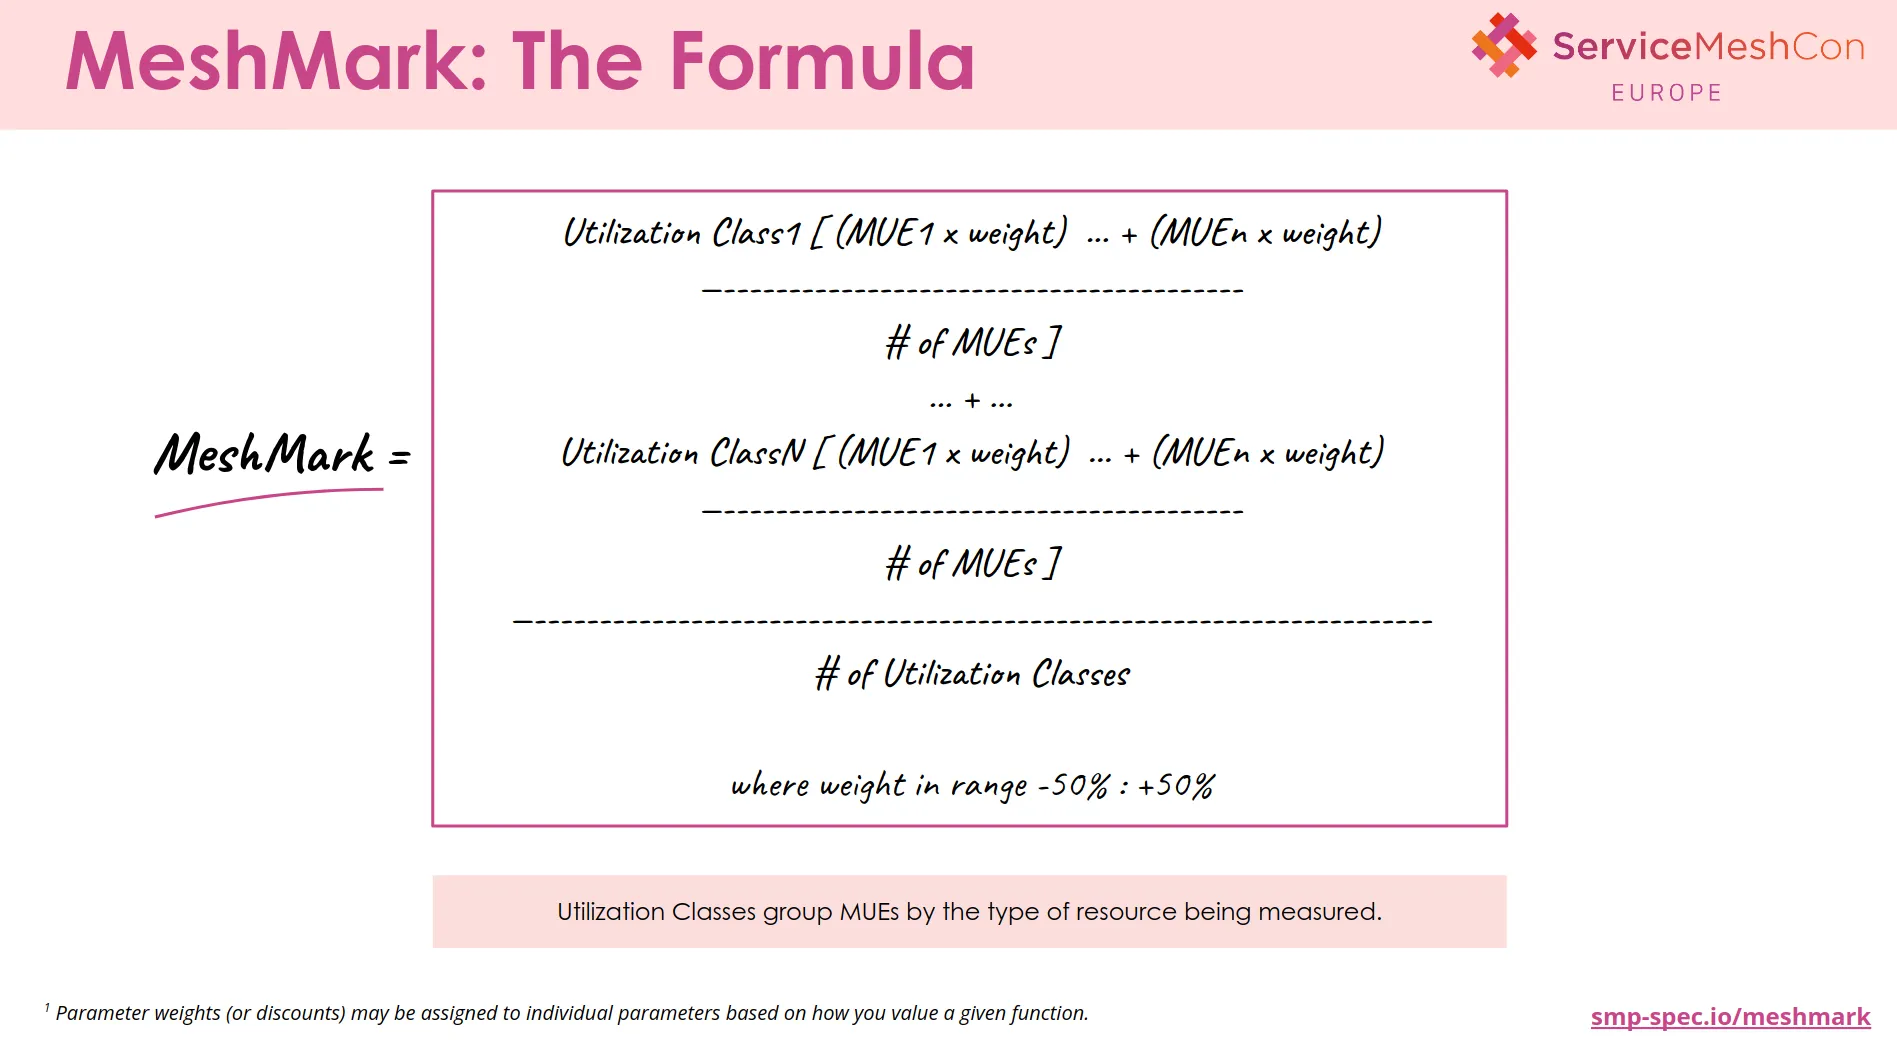
MeshMark The Formula
MeshMark functions as a value performance index (a scale) to provide organizations the ability to weigh the value of their service mesh versus the overhead of their service mesh and assess whether they are getting out of the mesh what they are “paying” for in it. MeshMark’s scoring system ranges from 0 to 100 and incorporates collections of resource utilization efficiency calculations, categorized into similar consumption classes.
Mrittika explains MUE
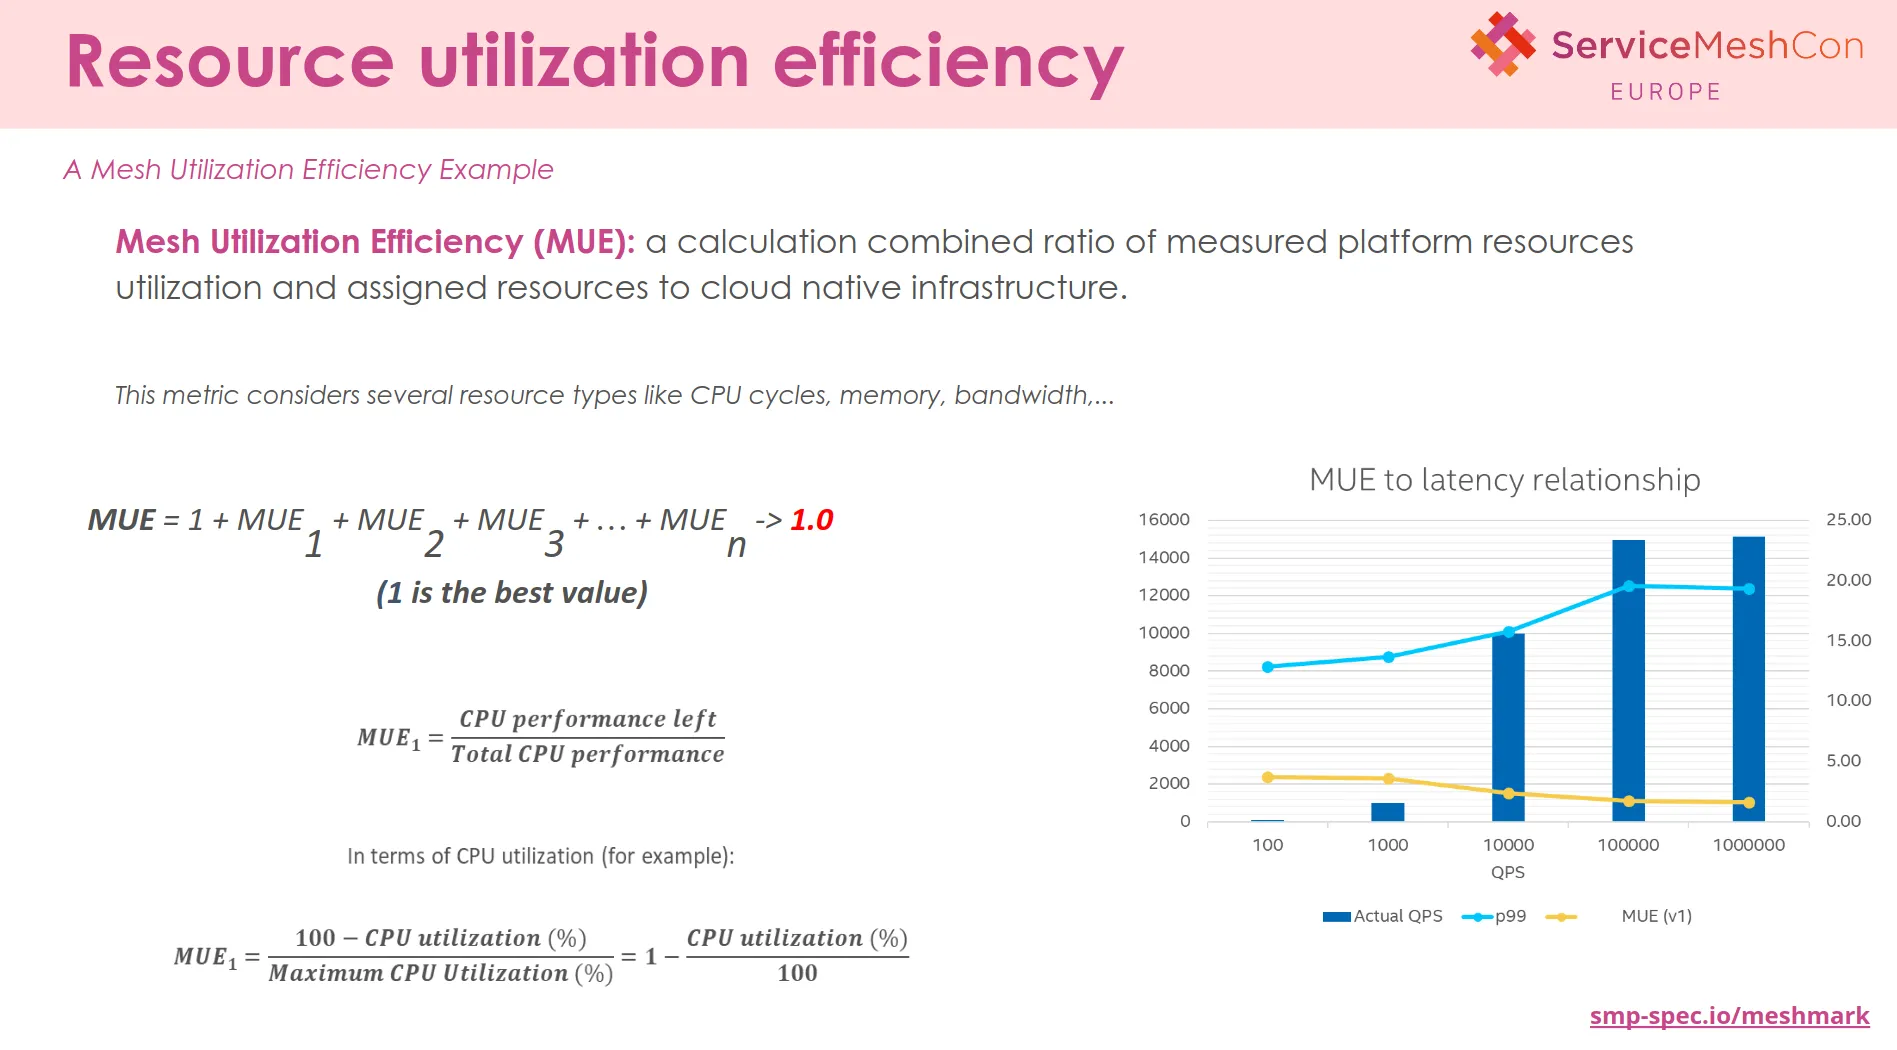
It's a calculation, combined ratio of measured platform resources to assign resources. If you're able to measure what your assigned resources are in whatever form and able to also monitor what's the used resources, you can have this ratio. So, for example, a very simple one is CPU performance.
Lee demonstrates MeshMap with an example Consul application
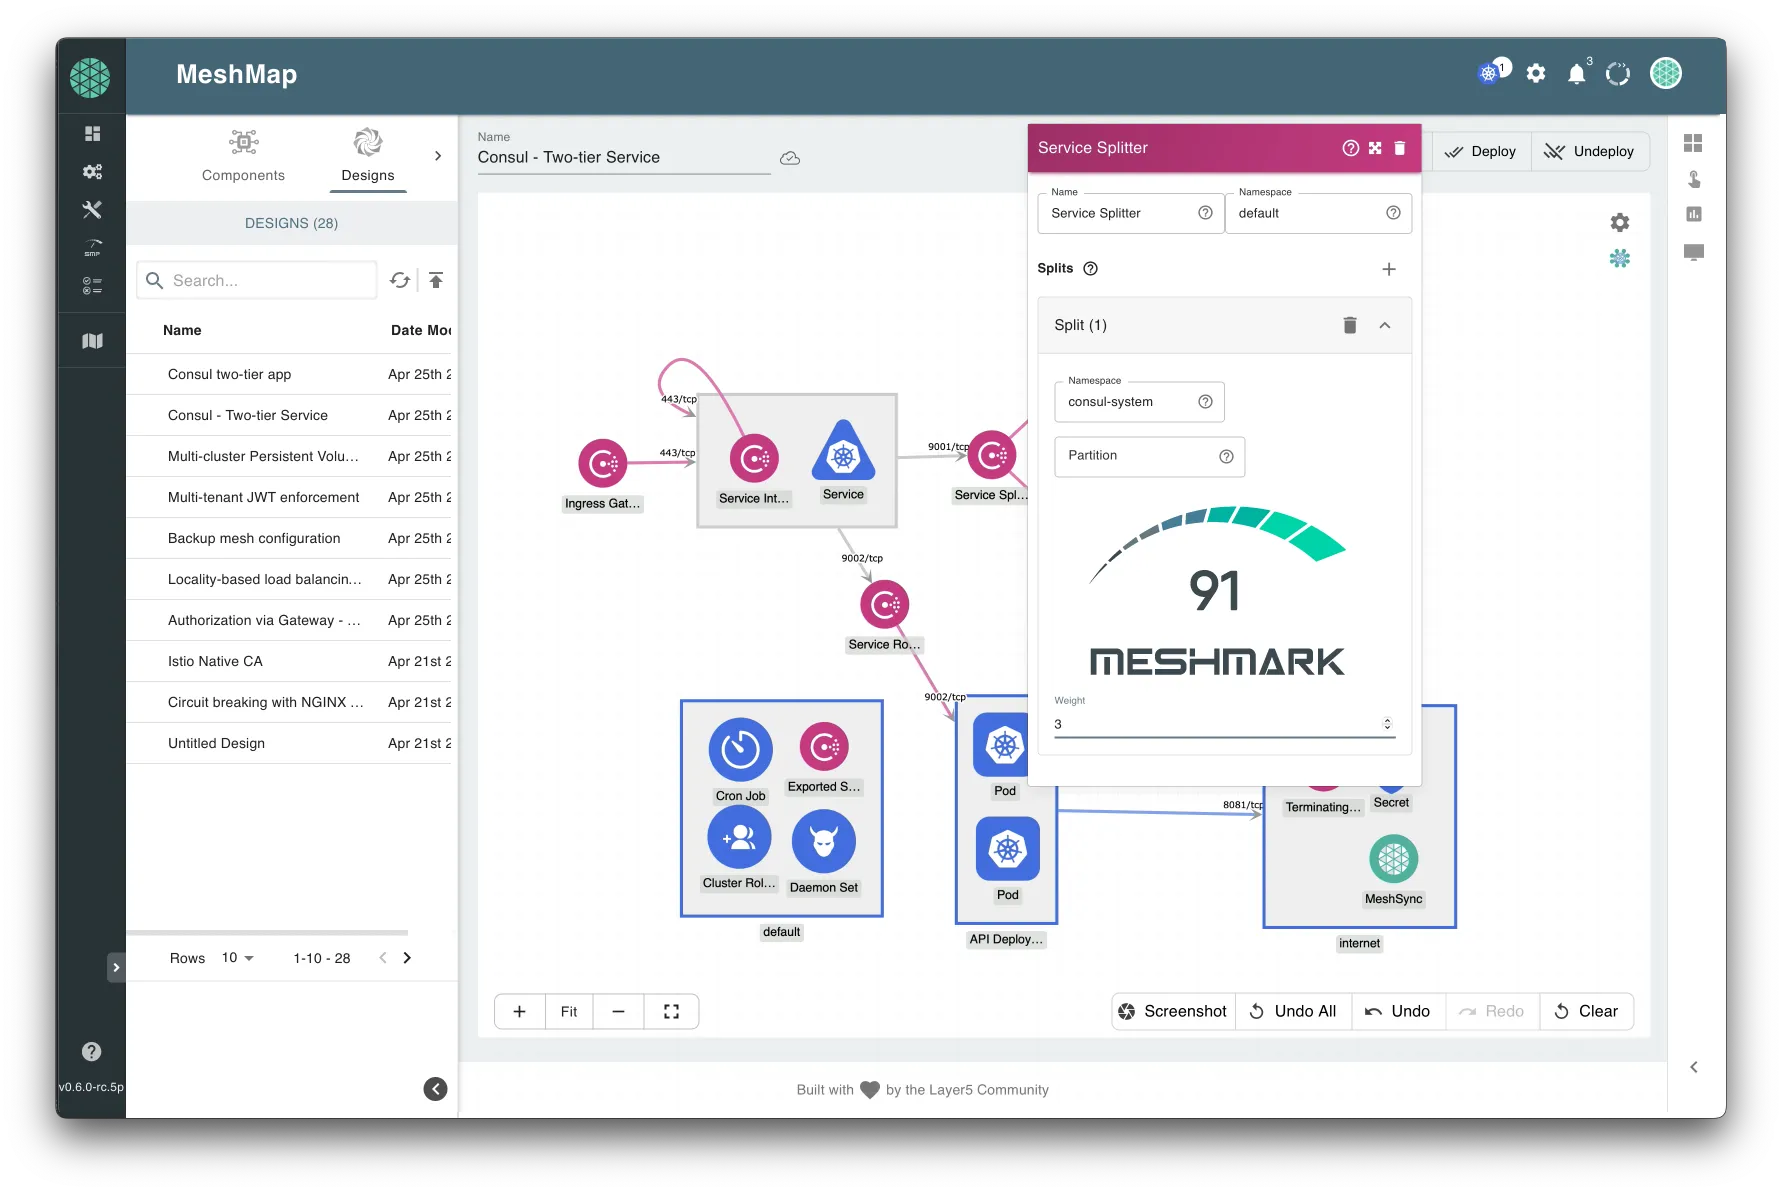
Let's take an example workload a Consul application, load it into the visual designer, take a look at the service splitting functionality of console and note in this case we're assigning a weight of three when we can change that to four to derive its MeshMark which is a mesh utilization efficiency calculation of the efficiency by which that network function is being performed. We could also take a look at service intentions of console and examine the efficiency of that network function. Now that you've seen the demo you want to go ahead and publish the results and call everyone to get together.
MeshMark in Meshery (an excerpt from ServiceMeshCon EU 2022 demo)
Lee Calcote and Mrittika Ganguli covered all the concepts of SMP and MeshMark in this great talk. Learn more about MeshMark on the Service Mesh Performance website.


