


The world of software development is embroiled in a silent war – the Observability Arms Race. On one side, verbose logs, relics of our debugging days, threaten to devour production budgets. On the other, traces, the Sherlock Holmes of observability, offer targeted insights but come with their own complexities.
All signals have different ways to be collected/instrumented. They also have different resource costs to obtain, store, and analyze, while providing different ways to observe the same system. Choosing between them, or all of them, is a game of trade-offs like all other tasks in engineering. In the next sections, we’ll help you make this decision by digging deeper into each signal, starting with the most popular ones: metrics, logs and traces, and then the two new possible signals: application profiles and crash dumps.
The Logpocalypse Looms:
Remember that single log statement you sprinkled in development? Imagine it bombarded with millions of hits daily in production. The cost implications are staggering. Are we clinging to outdated habits, drowning in a sea of irrelevant data?
Log levels offer some relief, silencing the noise in production. But what if that critical error gets buried under an avalanche of info logs? Is there a risk of sacrificing valuable insights for a false sense of cost control?
Traces: A Targeted Approach Emerges:
Traces offer a compelling alternative. They map a request's journey through your system, meticulously recording events and their connections. This targeted approach inherently generates less data, making them potentially cost-effective.
Tracing offers the ability to granularly track request segments (spans) as the request is processed across various services. It is hard to introduce later, one reason being third party libraries that are used by the application also need to be instrumented. The cost of distributed tracing can be high, and so, most service mesh tracing systems employ various forms of sampling to capture only a certain portion of the observed traces. When traces are sampled performance overhead and storage costs are reduced, but so is your visibility. The rate at which sampling is done is a balance between the frequency by which traces are captured (typically expressed as a percentage in relation to service request volume).
Figure: Cost vs. Value Spectrum
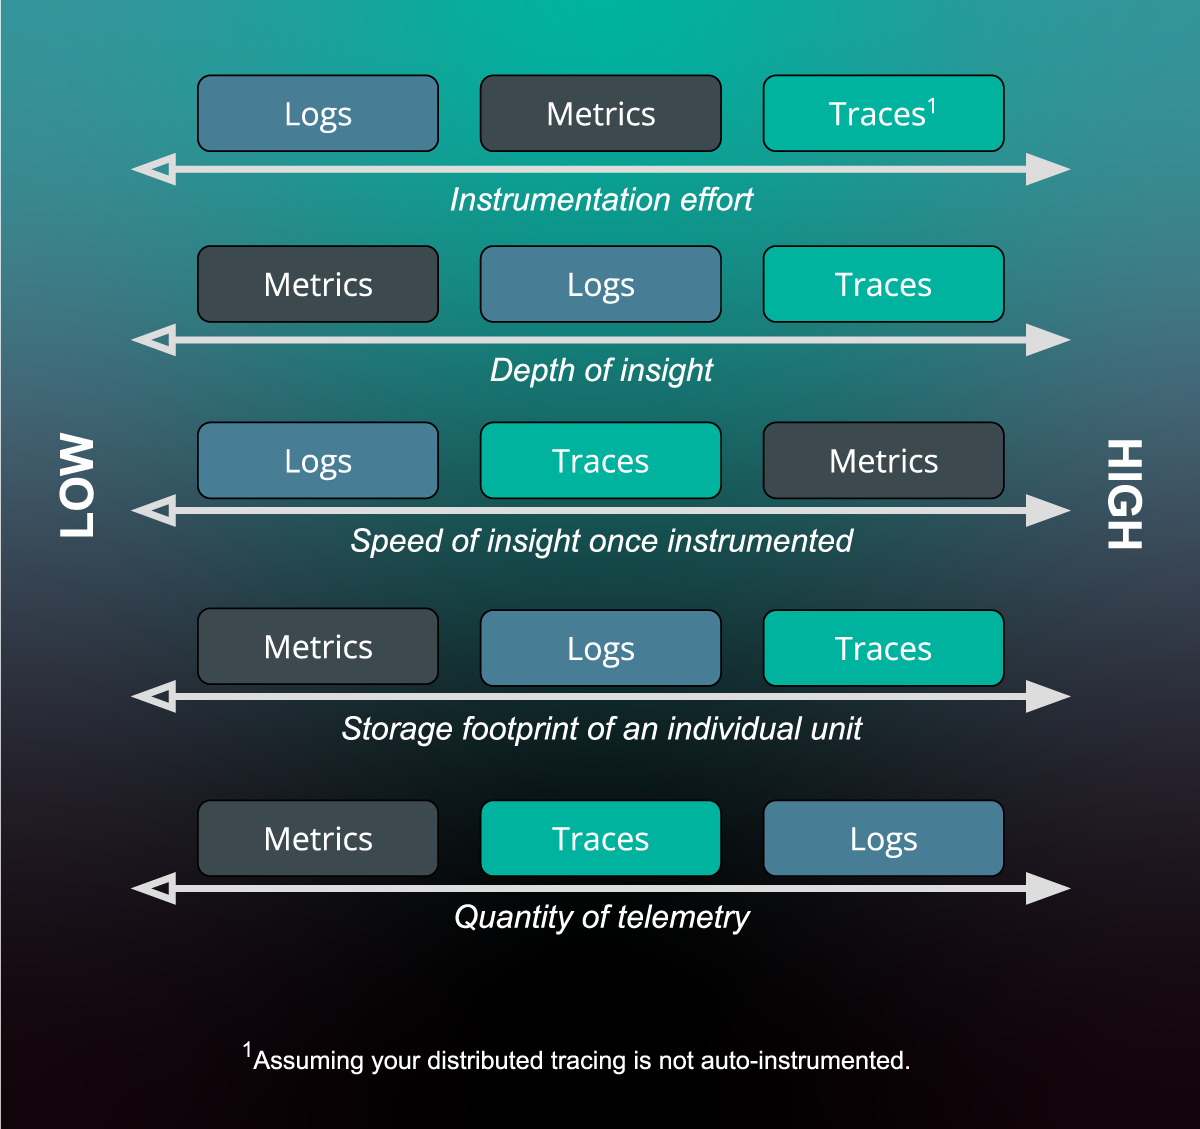
Figure: a comparative spectrum of value provided by and cost of each pillar.
The figure above presents a visual spectrum that acknowledges that collecting telemetry in production is a compromise between cost in terms of storage and performance (CPU, memory, and request latency) overhead, and the value of information collection, typically in terms of how expressiveness it is or useful it is in solving puzzles of slow or errored responses. It’s argued that metrics provide the highest value for the smallest investment. Given that some service meshes facilitate distributed tracing, an argument that distributed tracing provides the highest value and can be achieved at low investment (relative to the amount of insight provided). Ideally, your instrumentation allows you to dial back the verbosity levels and sampling rate to facilitate control over your overhead costs vs desired observability.
We won't dive into metrics as a signal in this post, but will ackowledge their use and validaty in the converation. Metrics also represent point in time observations of the state of a system. This differs from logs or traces, which focus on records or information about individual events.
The Power of Smart Sampling
Not all traces are created equal. Simple sampling techniques can leave you blindsided. The key lies in dynamic/adaptive tail sampling – a detective sniffing out the real clues in a crime scene, focusing on the most valuable traces.
The Power of Smart Sampling with Jaeger
We've established that simple, "dumb" sampling techniques for traces can leave you blindsided. Imagine a scenario in Jaeger, a popular distributed tracing platform, where every trace has a 10% chance of being captured, regardless of content. Crucial errors with low occurrence might slip through the cracks.
This is where dynamic/adaptive tail sampling, a champion feature of Jaeger, enters the scene, offering a more intelligent approach. Here's how it works within the Jaeger ecosystem:
Jaeger's Collector Takes Center Stage: As traces flow into your Jaeger collector, it doesn't make a snap decision about sampling. Instead, it analyzes key characteristics of each trace using Jaeger's robust sampling framework. This might include:
- Span Duration: Did a particular span within the trace take an exceptionally long time, indicating a potential bottleneck in a specific service?
- Error Tags: Did any spans within the trace contain error tags, suggesting something went wrong?
- Service Names: Was a specific service involved in the trace that's known to be error-prone based on historical data?
Prioritizing the Catch: Based on analysis, the Jaeger collector assigns a sampling probability to each trace. Traces with characteristics suggesting valuable insights (e.g., slow spans, errors) will have a higher chance of being captured. On the other hand, common, routine traces might be sampled at a lower rate.
The Jaeger Detective at Work:
Think of Jaeger's dynamic/adaptive tail sampling as a detective sifting through a crime scene. They don't blindly collect every span within every trace. Instead, they prioritize clues based on their potential significance – error tags within a span get captured with a higher probability than a normal database access span in a healthy service.
This intelligent approach ensures you capture the valuable traces while keeping the cost under control. But even with Jaeger, there are good and bad practices to consider:
- Bad Practice: Sampling Everything (Jaeger YAML configuration):
1# This configuration captures EVERY trace, defeating the purpose of sampling.2sampler:3 type: probabilistic4 param: 1.0
- Good Practice: Prioritize Errors (Jaeger YAML configuration):
1# This leverages Jaeger's ability to identify traces with errors.23sampler:4 type: probabilistic5 param: 0.1 # Capture 10% of normal traces6 samplingStrategy:7 perOperation: # Define per-operation sampling strategies8 "*": 0.19 "payment-service.processPayment": 1.0 # Capture all traces for payment-service.processPayment
Jaeger Tracing Operator: Best Practices
The Jaeger Tracing Operator simplifies deploying and managing Jaeger in Kubernetes environments. Here's how to leverage it with best practices:
Install the Jaeger Operator: Follow the official guide to install the Jaeger Operator in your Kubernetes cluster.
Define Jaeger CRDs with Sampling Strategy: Use Custom Resource Definitions (CRDs) provided by the operator to configure your Jaeger instance. Within the CRD YAML, define the
samplersection as shown in the good practice example above.Tailor Sampling for Specific Services: The Jaeger Operator allows granular control over sampling strategies. You can define specific sampling probabilities for individual services within your application landscape.
Beyond the Basics:
Jaeger's dynamic/adaptive tail sampling offers a robust configuration system. You can define custom sampling strategies based on specific service names, tags, or even regular expressions within your traces. This granular control empowers you to tailor the sampling process to your unique application landscape.
Jaeger: Ideal, or Not Quite?
Jaeger is a powerful tool for distributed tracing, but it's not a one-size-fits-all solution. Here's a quick reflection:
- Strengths: Jaeger excels at cost-effective observability with its smart sampling and ease of use.
- Considerations: While Jaeger offers flexibility, configuration can become complex for intricate setups. Additionally, Jaeger itself requires some infrastructure overhead.
The Takeaway:
By embracing Jaeger's smart sampling techniques and leveraging the Jaeger Tracing Operator for best-practice deployments, you can move beyond the reactive "log everything" mentality and enter a new era of cost-conscious, insightful monitoring. Remember, the ideal tool depends on your specific needs. Explore your options – Jaeger might be your perfect partner, or it might be the first step on your journey to finding the ideal distributed tracing solution for you.
The Future of Observability Beckons:
The future of observability isn't about logs versus traces. It's about embracing a proactive approach. It's time to move beyond the reactive "log everything" mentality. By adopting smarter practices, we can create a future where observability doesn't break the bank. Let's ditch the cost-prohibitive logpocalypse and unlock the power of targeted, insightful monitoring. The choice is clear.