Several weeks ago, I wrote a blog post about introducing "comparative spectrum" tools to the Layer5 landscape—a webpage which I have transformed multiple times, now!
Up until now, the contents of each blog post I have written were centered upon a freshly-opened pull request. Shortly before writing my last post, I did open one such pull request (layer5#238). However, since my PR remains open, and since I am still working on the same issue my PR addresses, I have opted to instead push a new commit to the aformentioned (but, now, renamed) PR instead of creating a whole new one. This newest commit introduces a major step towards resolving the issue at hand, and will be the subject of this blog post!

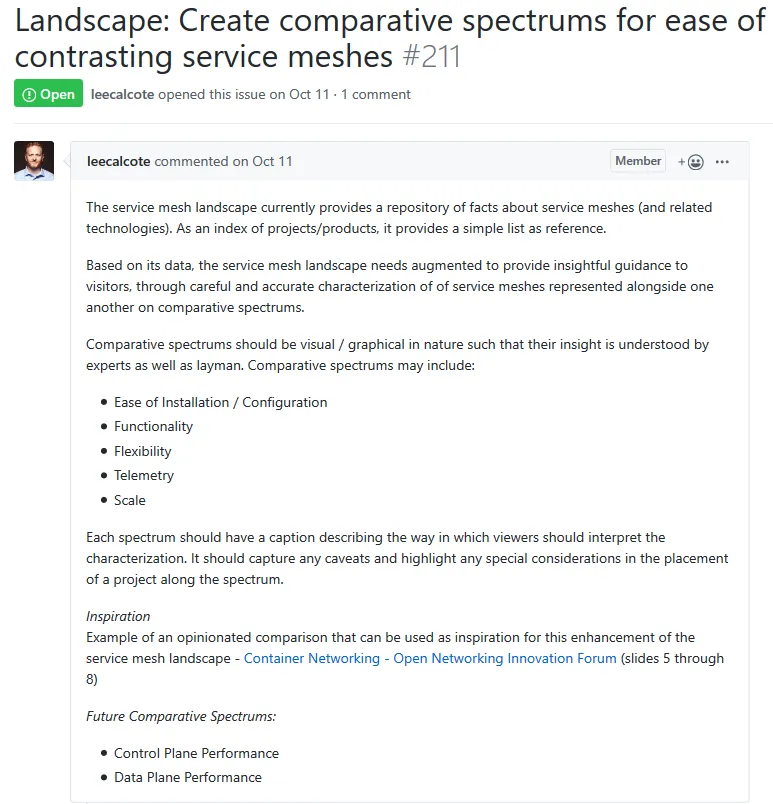
The issue at hand: layer5#211 - add comparative spectrums to the Landscape page
Note: this blog post will frequently reference the update and documentation comment that I made to accompany my last commit to my PR. I consider this hefty comment to be an extension of this blog post, so I strongly recommend giving it a read!
My initial commit towards introducing comparative spectrum tooling did not represent a full solution. Thinking about what might constitute a full solution for the issue at hand, I came up with three criteria:
What was still needed:
1. A complete toolset
Within Issue #211, Layer5 lead developer Lee indicates four slides upon which comparative spectrum graphics may be based upon. During my initial commit, I created graphics that emulated those found within the first three of those four slides, but I had yet to implement the graphic found in the fourth: a table. I was also less-than-satisfied with the 'grid' design I had implemented in response to slide 7.
2. A modular design
The designs I am implementing are meant to be used to present opinionated information. As I am not nearly knowledgeable to form opinionated comparisons between DevOps tools and related technologies, I have instead made my goal to make it as easy as possible for other Layer5 contributors to utilize the graphics ("[comparative] spectrums") that I am designing. Doing so would require encapsulating (templating) the spectrums I design (new and old), within their own HTML files, and providing a means to easily invoke (and customize) instances of those templates into the Landscape page.
3. Documentation
Because the templates I design are intended to be implemented and customized by other contributors, it is especially critical that those contributors have access to complete and thorough documentation detailing the intended use of each templated design.
What I delivered:
1. A complete toolset
As documented in my update comment, I designed a table that very closely resembles that of Lee's slides. Implementing the table was interesting, as it ended up requiring quite a few nested Liquid for-loops. Also as documented, I revamped the grid-based tooling and am quite pleased with the improvements made. The end result of these efforts is a complete set of comparative spectrums.
2, 3. A modular design and documentation
The bulk of the documentation I wrote details how to deal with the modular solution that I designed and implemented to enable comparative spectrums to be included into the Landscape page (through the use of Liquid include tags). The documentation speaks for itself; check it out!
What's next?
I would not have considered the documentation I delivered to be complete if I did not report on the issues still present in the work I delivered. I denoted these as 'Current issues' in the documentation, and they represent work that still remains to be done. I know that I can count on the Layer5 community to assist me with small issues like these, and, once this pull request receives some forward motion, I hope to start zeroing in on its smaller issues. Fortunately, I have made plans to continue working with open source well into the new year!

